3235:Ultraviolet-Visible Spectroscopy
Ultraviolet-Visible Spectroscopy
Introduction:
Spectroscopy:
Spectroscopy is the study of interaction between matter (mass) and radiated energy.
Such interaction includes –
Such interaction includes –
- Absorption of the incident radiant energy.
- Emission of radiant energy.
- Scattering or reflection of incident radiant energy.
- Impedance of radiant energy transmission.
- Changing the frequency/wavelength of the transmitted radiant energy.
- Causing interaction between molecules in a non-stationary state and sustaining it.
Absorption spectroscopy/spectrometry:
Absorption spectroscopy may be defined as the analysis of chemical substances by measurement of the amount of radiant energy absorbed
by the substance.
by the substance.
UV-Visible spectroscopy:
UV-visible spectroscopy is a type of absorption spectroscopy which uses the UV and visible part of the EM spectrum.
Electromagnetic (EM) spectrum:
Spectrum:
Spectrum is the condition where a characteristic is not limited to a fixed set of values rather it varies infinitely within a continuum.
By that definition, radiation arranged by wavelength is a spectrum; drug activity in terms of action against bacteria is a spectrum.
Electromagnetic spectrum:
It is the arrangement of all types of electromagnetic radiation in order of their increasing or decreasing wavelength (or frequency).
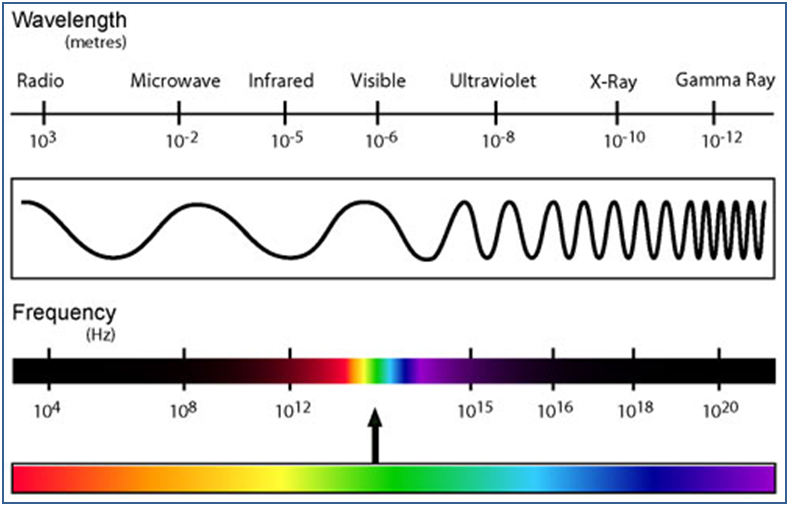
The above diagram shows the electromagnetic spectrum where radiations are arranged in the decreasing order of wavelength from left to
right.
Visible and UV spectrum:
Color
 | Wavelength |
Violet
|
400-420
|
Indigo
|
420-440
|
Blue
|
440-490
|
Green
|
490-570
|
Yellow
|
570-585
|
Orange
|
585-620
|
Red
|
620-780
|
The visible spectrum starts at 400 nm and ends at around 700 nm. The electromagnetic radiation adjacent to the violet visible radiation is
called ultraviolet radiation. The electromagnetic radiation adjacent to the red visible radiation is called infrared radiation.
called ultraviolet radiation. The electromagnetic radiation adjacent to the red visible radiation is called infrared radiation.
The UV spectrum ranges from 10 nm to 380 nm. The UV radiation has been classified as UV A (400-315 nm), UV B (315-280 nm) and UV C
(280-10 nm) based on their wavelength.
(280-10 nm) based on their wavelength.
Relationship between wavelength & color
Wavelength (nm)
|
Spectrum region
|
Colour absorbed
|
Colour transmitted
|
400-420
|
Visible
|
Violet
|
Green-yellow
|
420-500
|
Visible
|
Blue
|
yellow
|
500-570
|
Visible
|
Green
|
Red
|
570-600
|
Visible
|
yellow
|
Blue
|
600-630
|
Visible
|
orange
|
Green-blue
|
630-700
|
Visible
|
Red
|
Green
|
Electromagnetic radiation:
Electromagnetic radiation is a form of energy that shows wave-like characteristics and –
- It can travel without any medium
- At vacuum it moves at speed of light
- Contains both electric and magnetic field components. These two components oscillate (moving back and forth) in a phase
perpendicular to each other. When an electric field oscillates it causes the oscillation of the corresponding magnetic field which in turn
oscillates the next electric field. Thus the EM radiation moves forward without any medium.
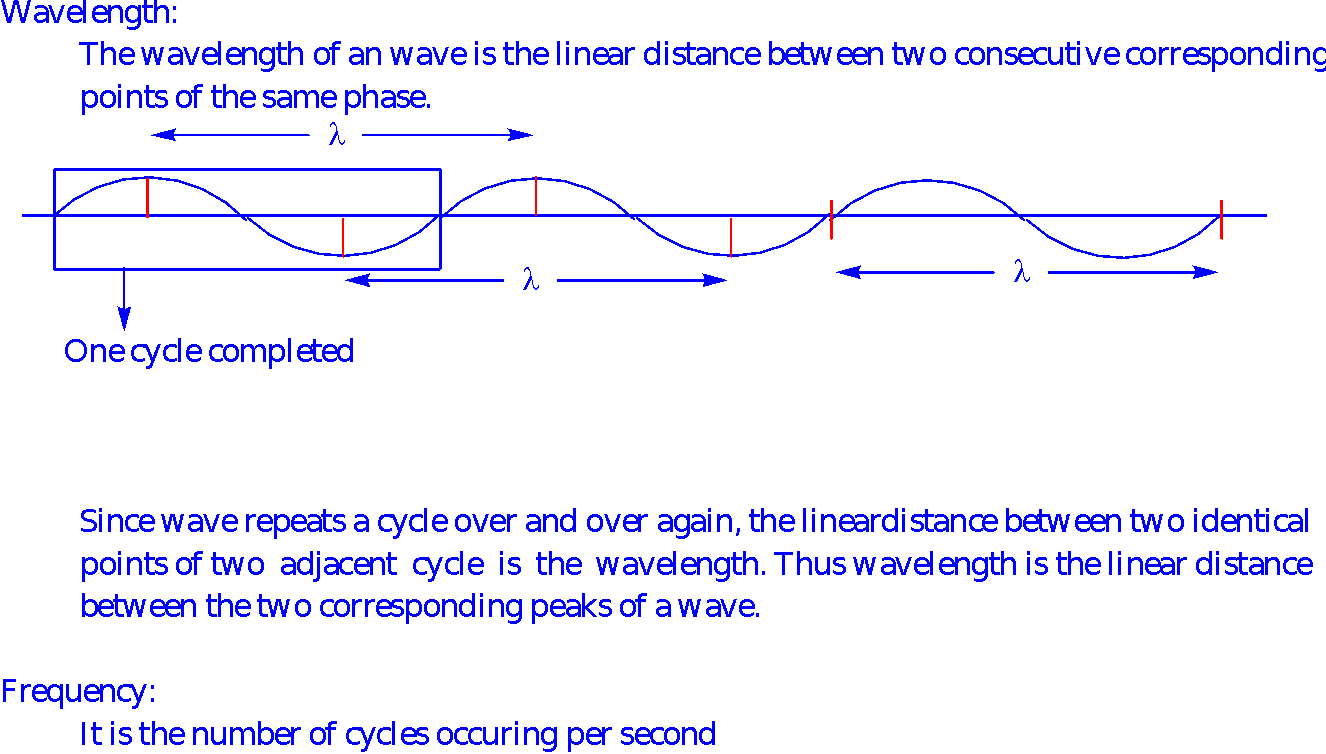
EM radiation is described by wavelength (λ) or frequency (n). The relationship between wavelength and frequency is given in following
equation.
equation.
Where c is the speed/velocity of the wave. At vacuum c is equal to the speed of light i.e.
frequency value for analytical purposes and wavelength value is of more importance.
Effect of electromagnetic radiation on a substance:
When a beam of electromagnetic radiation passes through a transparent medium of the substance (the substance under analysis must be in
solution for proper analysis), the radiation is absorbed and/or transmitted by the substance. The absorption of the radiation depends on
the –
solution for proper analysis), the radiation is absorbed and/or transmitted by the substance. The absorption of the radiation depends on
the –
- Chemical nature of the substance
- Wavelength of the radiation
The radiation not absorbed is transmitted by the substance and it is called transmitted light which can be measured by an instrument called
the spectrophotometer. The record is called the spectrum of that substance.
the spectrophotometer. The record is called the spectrum of that substance.
Transmittance “T”
The amount of light that passes through a particular thickness of solution is known as transmittance T.
Transmittance can be expressed as the ratio of the intensity of the transmitted light I to the intensity of the incident light beam Io

Absorbance “A”
The negative logarithm of the base ten of transmittance is called absorbance.
It is also called optical density.
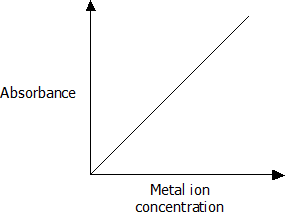
Absorbance is directly proportional to the concentration of the solution when the thickness of the medium is constant.
Laws governing spectrophotometry
As described before, when a substance is placed in the path of light (EM radiation), a number of events e.g. absorption, transmission, elastic
and nonelastic scattering of light may take place.
and nonelastic scattering of light may take place.
The absorption of EM radiation/light by molecules is governed by two laws – Lambert’s law and Beer’s law.
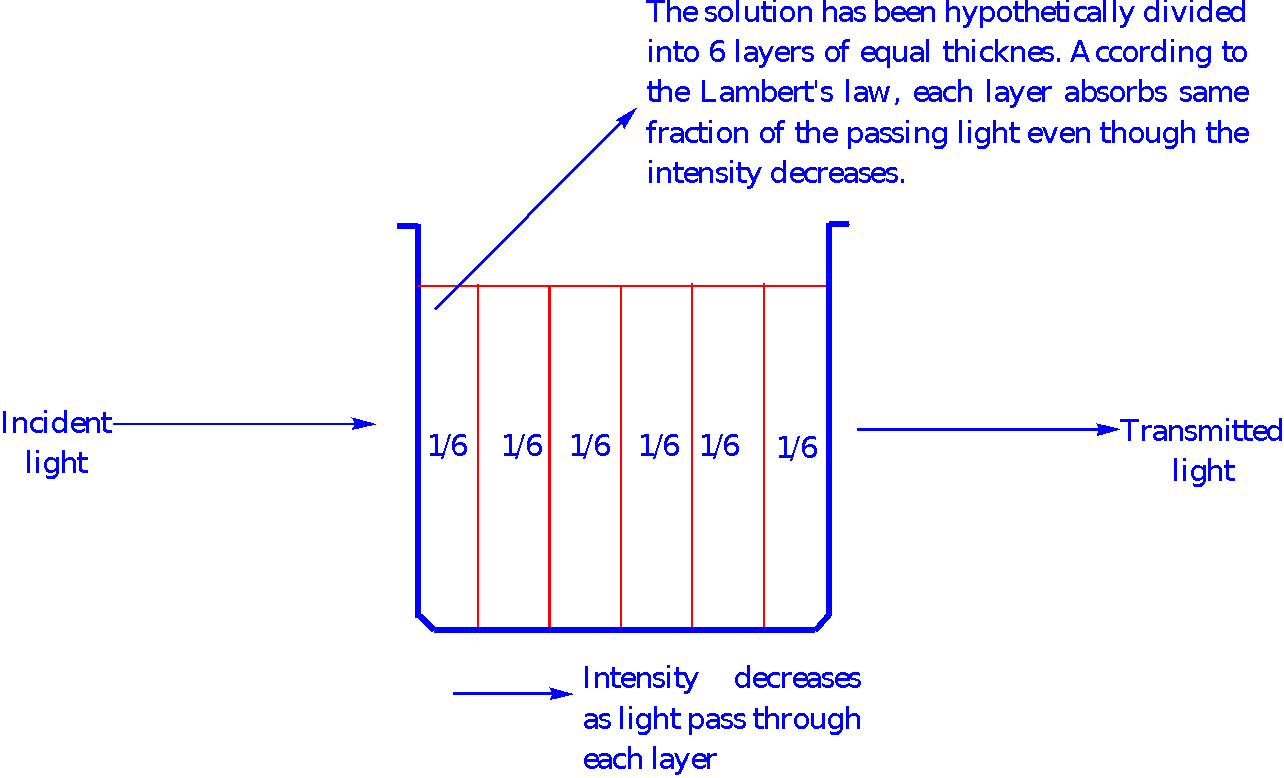
LAMBERT'S LAW
Lambert described how intensity changes with distance in an absorbing medium.
Lambert’s Law: When a beam of monochromatic radiation is passed through a solution of an absorbing medium, the decrease in the intensity
of radiation with thickness of the solution is directly proportional to the intensity of the incident light.
of radiation with thickness of the solution is directly proportional to the intensity of the incident light.
Let,
I be the intensity of incident radiation.
b be the thickness of the solution.
Then
 K'=Absorbing co efficient or Proportionality constant
Now integrating the equation between the limit I=Iₒ at b=0
And I=I at b=b
We get,


 Where
Where
We know that absorbance 
Thus A= Eb
A∞b
The amount of light absorbed by the medium (solution/ sample) at a given wavelength is proportional to thickness of the absorbing layer i.e.
path length of the light
path length of the light
Basically it states that the absorbance is proportional to the path length i.e.
A∞b
Beer’s law
Relates the absorption of light to the properties of the material through which the light is travelling.
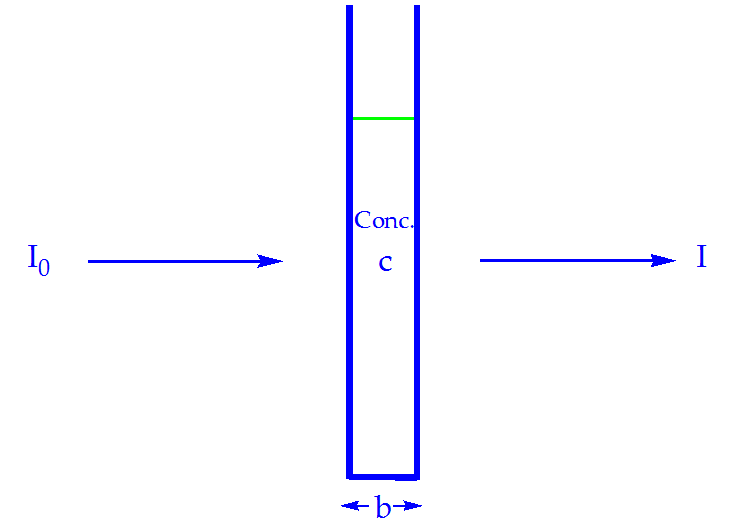
Beer’s Law: When a beam of monochromatic radiation is passed through a solution of an absorbing medium, the decrease in the intensity of
radiation with thickness of the solution is directly proportional to the intensity of the incident light as well as concentration of the solution.
radiation with thickness of the solution is directly proportional to the intensity of the incident light as well as concentration of the solution.
Let I be the intensity of incident radiation.
x be the thickness of the solution.
C be the concentration of the solution.


K'=Absorbing co efficient or Proportionality constant

Now integrating the equation between the limit I=Iₒ at x=0
And I=I at x=l (l=Path length of the sample which is usually 1 cm)
we get

 Where
Where  =Extinction co efficient
We know that absorbance
Thus A=E.C.l
From the equation it is seen that the absorbance which is also called as optical density (OD) of a solution in a container of fixed path length is
directly proportional to the concentration of a solution.
directly proportional to the concentration of a solution.
Accordingly The amount of light absorbed by the a medium (solution/ sample) is proportional to the concentration of the absorbing material
or solute present.
or solute present.
This law states that absorption of the incident light is proportional to the number of absorbing molecules. So according to this law –
A∞c
Where, c is concentration of the substance in solution and A is absorbance.
Thus the concentration of a coloured solute in a solution may be determined in the lab by measuring the ABSORBANCY OF LIGHT AT A
GIVEN WAVELENGTH
GIVEN WAVELENGTH
Combining Beer’s law and Lambert’s law – Beer-Lambert law/Equation of absorbance:
According to the Lambert’s law –
According to the Beer’s Law –
Combining the two laws we have –
A∞bc

Where,

Absorptivity:
Absorptivity is a measure of how easily the absorbing molecules can absorb the electromagnetic radiation. It is specific for a given substance.
It is defined as the absorbance by a sample of unit concentration and where the path is of unit length.
It is defined as the absorbance by a sample of unit concentration and where the path is of unit length.
It is mathematically quotient of the absorbance (A) divided by the concentration of the solution (gm/L) and the path length (cm).
When c is expressed in moles/litre in the Beer-Lambert law, the absorptivity is called molar absorptivity or molar extinction coefficient and it is
expressed by
expressed by
When, c is expressed as %w/v, the absorptivity is expressed as .
.
Deviations from Beer-Lambert law
The accuracy of the Beer Lambert law is dependant upon some chemical and instrumental factors –
- This law specifically the part concerning concentration is not maintained in high concentrated solutions. This is because –
- In highly concentrated solutions, degree of interaction between molecules is higher at higher concentration. Thus the molecules
will not absorb radiation in same manner as when they are in dilute solution. - The absorptivity of solution doesn’t remain constant as the concentration changes.
- The refractive index of the solution may change in high concentration.
- If the solution contains particulate matter then scattering of light occurs which interfere with the absorption process.
- If the sample is fluorescent or phosphorescent then this law is not obeyed.
- If the light is non-monochromatic (in practice, monochromatic light is difficult to produce) i.e. not completely monochromatic.
Absorption of radiant energy
Effect on molecules upon absorption of radiation:
Electromagnetic radiation is energy. When a molecule absorbs radiation it gains energy. The higher the frequency the greater will be the gain
in energy. This energy can bring about one or more of the following changes –
in energy. This energy can bring about one or more of the following changes –
- The absorbed energy may break bonds within molecule. e.g. conversion of ergosterol to calciferol.
- The absorbed energy may increase vibration or rotation of atoms within the molecule. This principle is used in IR spectroscopy.
- It may change nuclear or electronic spin. This property is used in NMR spectroscopy.
- It may cause electrons to rise to higher energy level.
The UV and visible radiation absorption will cause the last effect i.e. transition of electrons within the molecule.
Energy of a molecule
Every molecule has a definite energy state. Energy possessed by a molecule can be classified in several categories. These are
- Transitional energy (Etrans)
- Vibrational Energy (Evib)
- Rotational Energy (Erota)
- Electronic energy (Eelec)
Transitional energy
Molecule as a whole can move from one place to another and the energy associated with this motion (Velocity) is called transitional energy
as well as the movement is called transitional
movement.
as well as the movement is called transitional
movement.
Vibrational Energy (Evib)
The movement of a part of a molecule or a group of molecules that move within themself is called vibrational movement and the energy
associated with this vibration is called vibrational energy.
associated with this vibration is called vibrational energy.
Rotational Energy (Erota)
Molecule can rotate along its axis and the energy associated with this rotation is called rotational energy.
Electronic Energy (Eelec)
Electrons of each atom moves around the central nuclei and the energy associated with this movement is called electronic energy
Translational < Rotational < Vibrational < Electronic

For example, a simple molecule, such as H2, may have the following energy levels:
Theory or principle of Electronic spectroscopy or molecular Spectroscopy
When a molecule absorbs electro magnetic radiation like UV or Visible light its electron gets promoted from the ground state to the higher
energy state or excited state.
(Ground State: The molecules when attained in a state, having lower energy level i.e. normal unexcited condition or state is called ground
state. Excited state: Absorbsion of EMR by the molecule results in the shipment of the molecule in the higher energy state called excited
state)
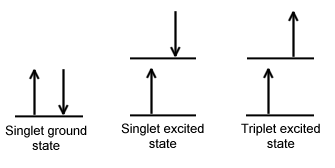
 In the ground state the spin of electrons in
 each molecular orbital is essentially paired. In the higher energy state, the spins of electrons are either paired i.e. excited singlet state or
parallel excited triplet state. Normally the absorption of the UV or visible light results in the transition of the singlet ground state to become
singlet excited state.
To get the molecule in the higher energy level the energy difference between the two energy level must be equal to the energy of photon
absorbed, which can be expressed as
absorbed, which can be expressed as
Energy required to get in the excited state, ΔE=E2-E1=hν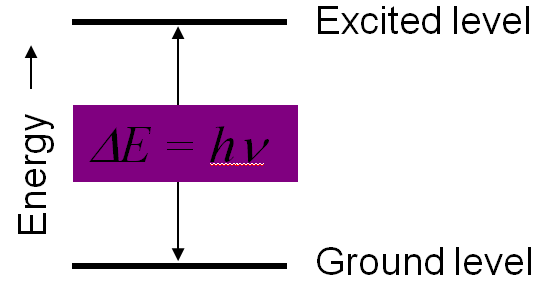
Here, E1= Lower energy level
E2=Higher Energy Level
h= Planks Constant
ν=Frequency
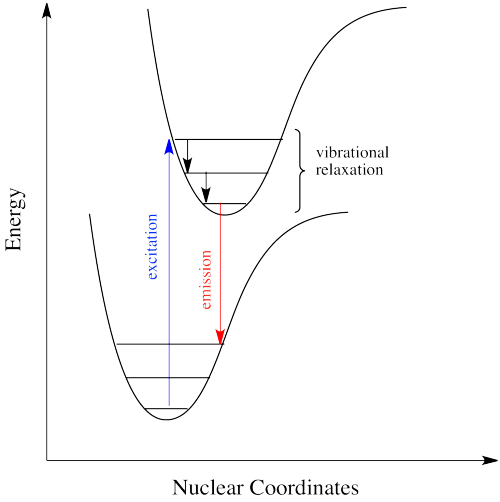
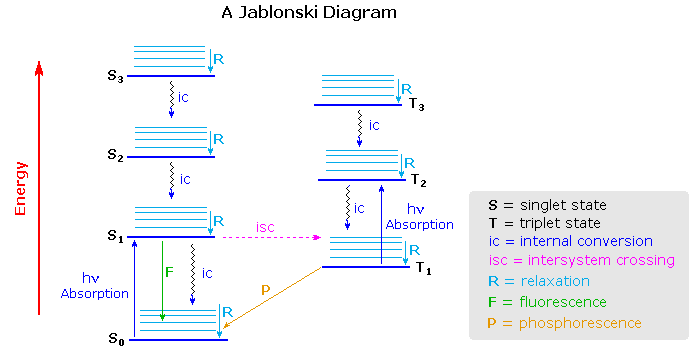
Generally the energy of the triplet excited state is lower than the singlet excited state. Thus to be stable the molecule quickly returns from one
of its higher energy level to lower one by the emission of radiation.
of its higher energy level to lower one by the emission of radiation.
Therefore an electron that has been raised to the higher energy level by the absorption of radiation, quickly returns to the ground energy level
within 10-8 seconds either directly or by the way of second excited state and will give molecular absorption spectrum.
within 10-8 seconds either directly or by the way of second excited state and will give molecular absorption spectrum.
(Molecular absorption spectrum: A set of bands or lines generated, due to the absorption of EMR by the molecules is called MAS. It is actually a graph
obtained by plotting the absorption against wavelength)
obtained by plotting the absorption against wavelength)
As the transmission rates are different for different molecule or structure, so the absorption spectra will be different also. Greater the number
of molecules capable of absorbing the light of different given wavelength the greater will be the extent of light absorption. MAS is
characteristics for a molecule and there is no similarity in MAS of one molecule with other, Thus it is used to in the quantitative analysis of the
molecules.
of molecules capable of absorbing the light of different given wavelength the greater will be the extent of light absorption. MAS is
characteristics for a molecule and there is no similarity in MAS of one molecule with other, Thus it is used to in the quantitative analysis of the
molecules.
Generally the absorption spectra is graphically represented by plotting the absorbance (A) on the Y axis and the wavelength on the x axis.;
This is the principle or theory of UV or visible molecular absorption spectroscopy.
This is the principle or theory of UV or visible molecular absorption spectroscopy.
Electronic transition
When UV and visible radiation excites the molecule the electrons are temporally moved from one orbital (bonding orbital according to MOT)
to another orbital (Anti-bonding orbital according to MOT). These electrons may be σ, π or n (non-bonding) electrons. (Time requires 10-8 sec)
to another orbital (Anti-bonding orbital according to MOT). These electrons may be σ, π or n (non-bonding) electrons. (Time requires 10-8 sec)
Thus possible transitions are –
- σ → σ*
- n → σ*
- π → π*
- n → π*
(There is no n* orbital as n electrons don’t form bonds).

σ → σ* transition:
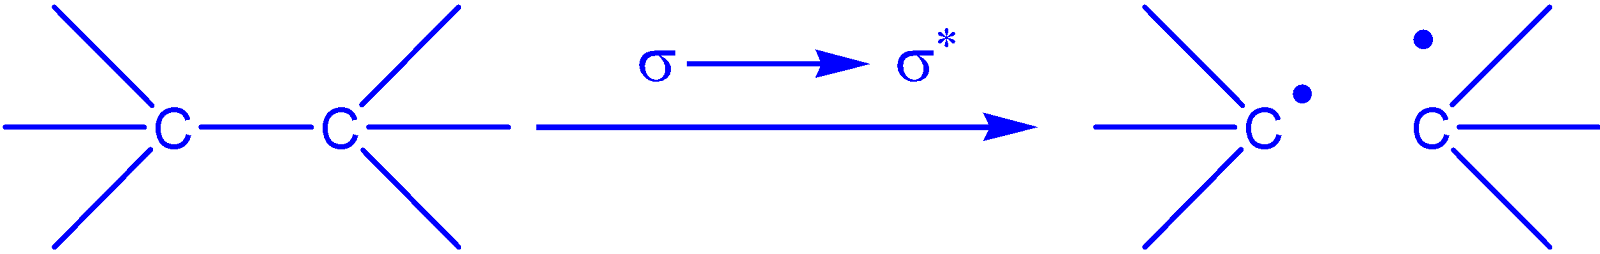
- This type of transition takes place in the saturated centre of the molecules.
- Here, an electron from a stable σ orbital goes to an unstable or anti-bonding σ orbital (represented by σ*).
- High energy is required to excite electrons present in the σ orbital as they are held tightly. Therefore saturated compounds do not
absorb radiation from normal UV-Vis spectrophotometer which generates radiation of 190-780 nm region.
n → σ* transition:
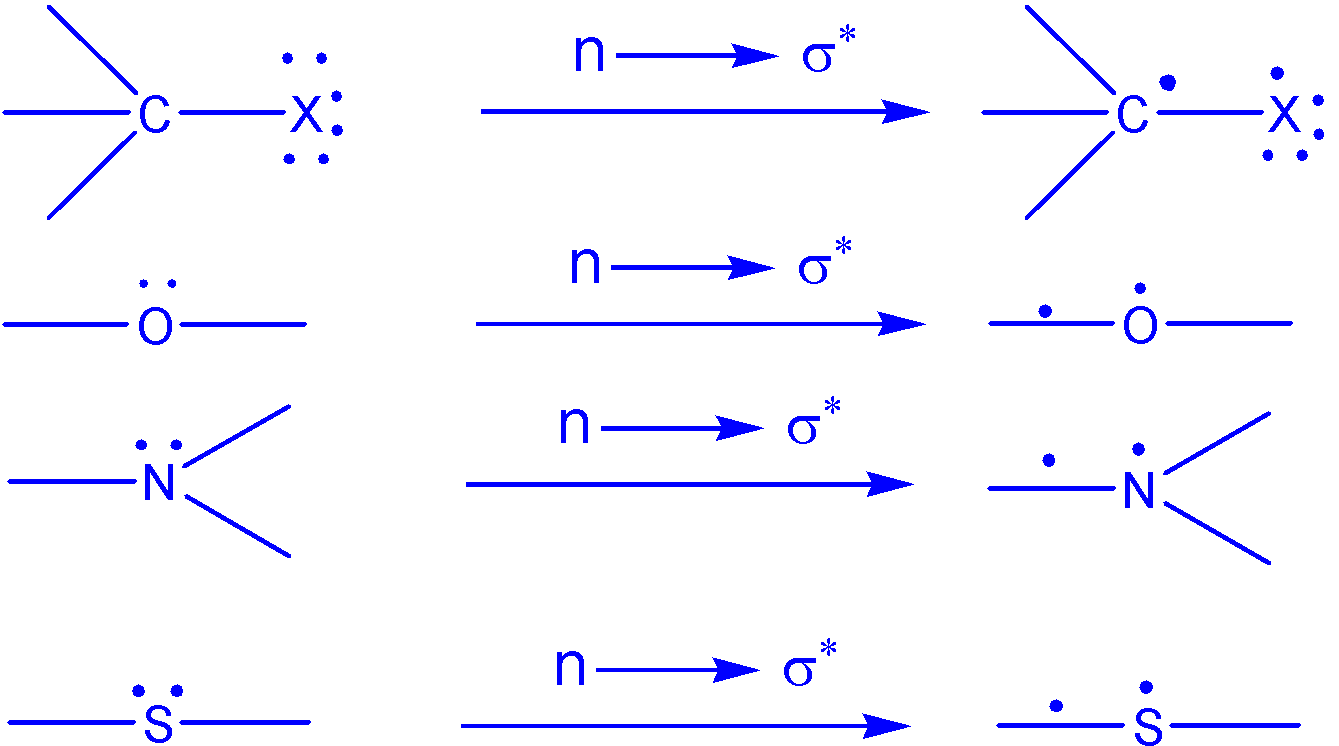
- This type of transition occurs in saturated compounds containing heteroatom which has an unshared electron pair.
- Electron transits from unshared pair to anti-bonding σ orbital.
- This type of transition may take place in halogen, sulfur, nitrogen and oxygen containing compounds.
- This transition requires high energy and therefore doesn’t occur in presence of the EM radiation produced by normal UV-Vis
spectrophotometer.
π → π* transition (K-band):

- Takes place in unsaturated compounds containing double or triple bonds.
- Electron transits from stable π orbital to an unstable/anti-bonding π orbital (represented by π*).
- It requires less energy as π bonds are sufficiently weaker than σ bonds. Conjugated double bonds further lowers required energy.
For example β-carotene containing 11 conjugated double bonds absorbs energy at 451 nm (visible region).
n → π* transition (R-band):

- This type of transition takes place in compounds having heteroatom which contains unshared electron pair.
- Electron transits from unshared pair to anti-bonding π orbital.
- Requires lower energy and therefore respond to the radiation produced by normal UV-Vis spectrophotometer.
- Carbonyl compounds, cyanides etc. show this type of transition.
Effect of solvents on electronic transition
The polarity of the solvent affect the energy required for electronic transition. This is described below. We need to remember that polarity
results from unequal distribution of electrons – the greater is the difference the greater is the polarity.
results from unequal distribution of electrons – the greater is the difference the greater is the polarity.
n → π* transition:
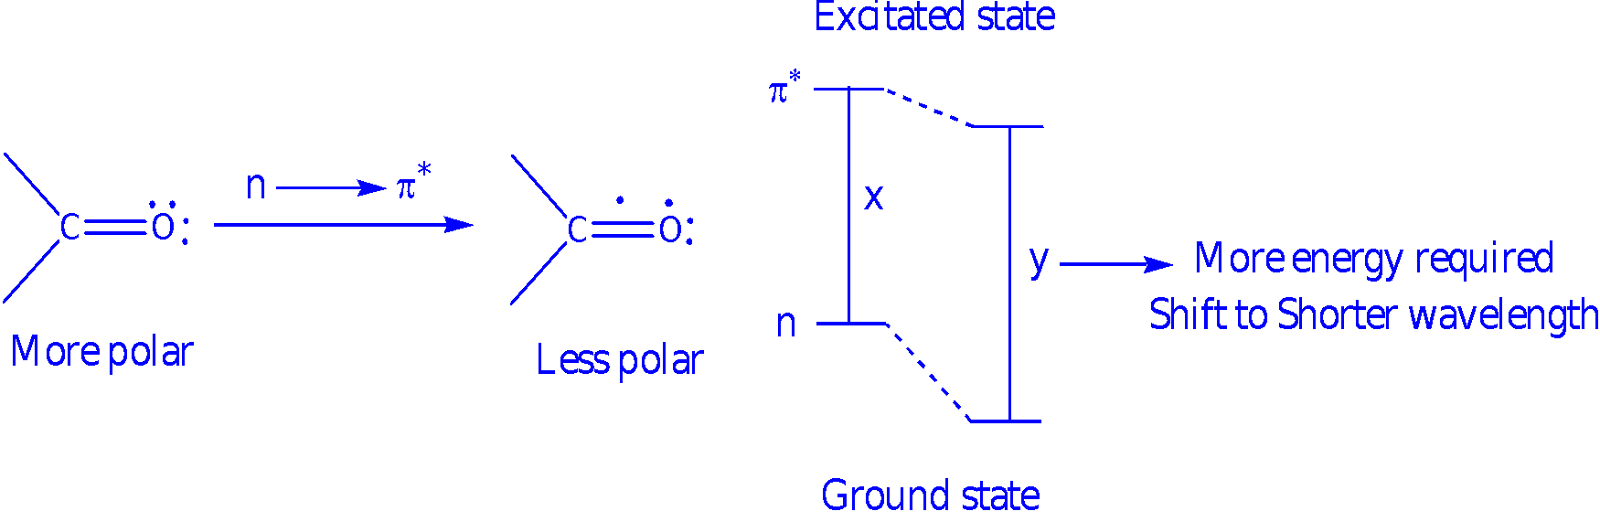
The diagram above illustrates the polarity of the molecule at excited state and ground state. If the solvent is polar, then dipole-dipole
interaction between the solvent molecule and sample molecule will be greatest at ground state. Hence, energy of the grounds state is
lowered significantly but that of excited state is raised (or not lowered significantly). The result is that more energy i.e. radiation of shorter
wavelength is required to excite the electrons.
π → π* transition:
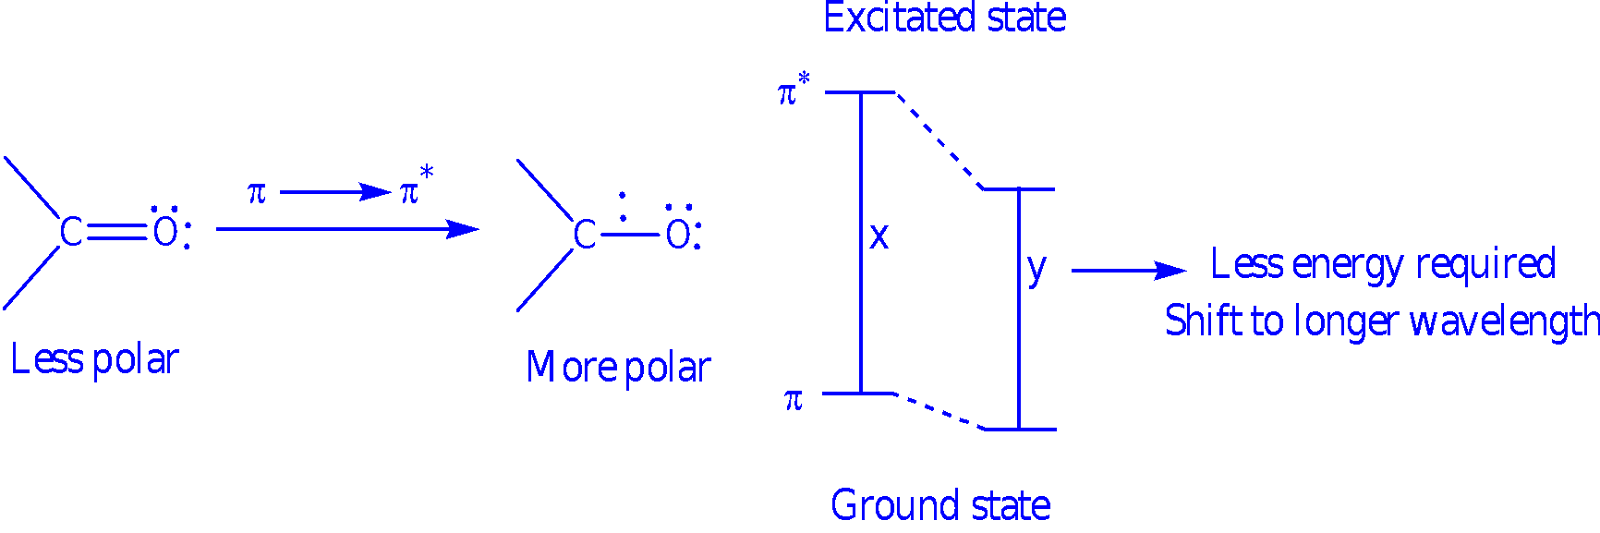
Here polarity increases after transition.
Thus the polar solvent molecule will show greater interaction with the excited state than with ground state. Hence, energy required for
excitation is decreased.
excitation is decreased.
n → σ* transition:
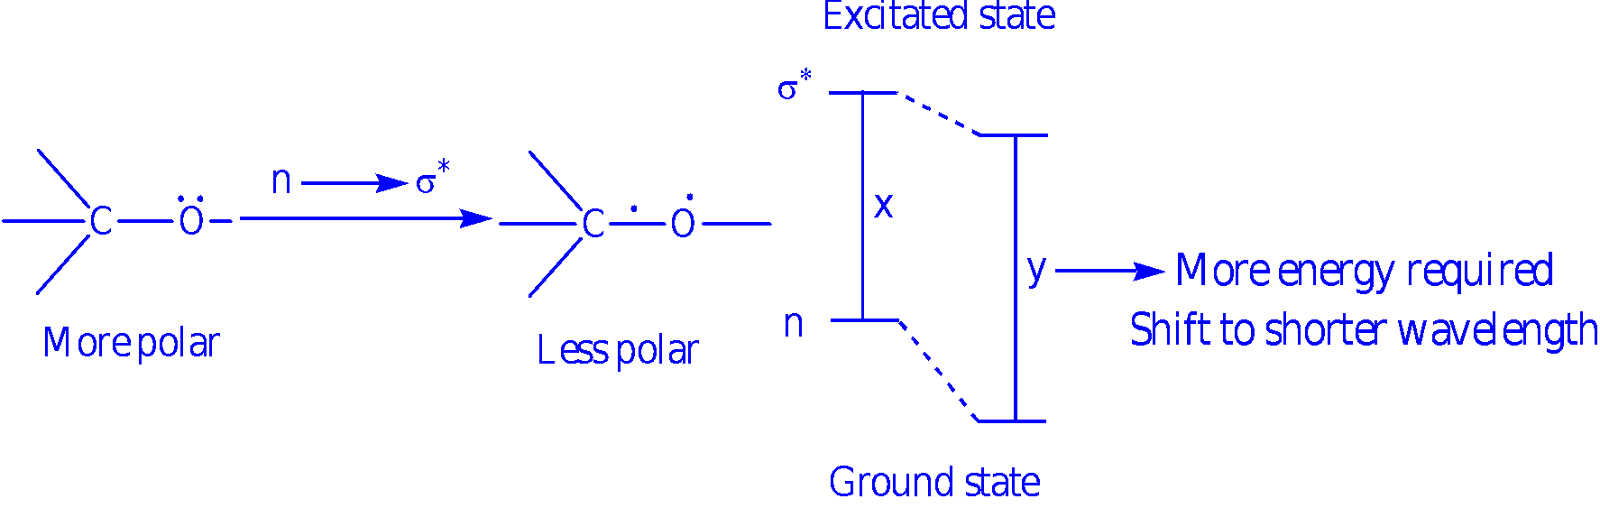
The polarity decreases after transition to excited state. So the polar solvent prefers the ground state. Hence more energy is required for
excitation.
excitation.
σ → σ* transition:
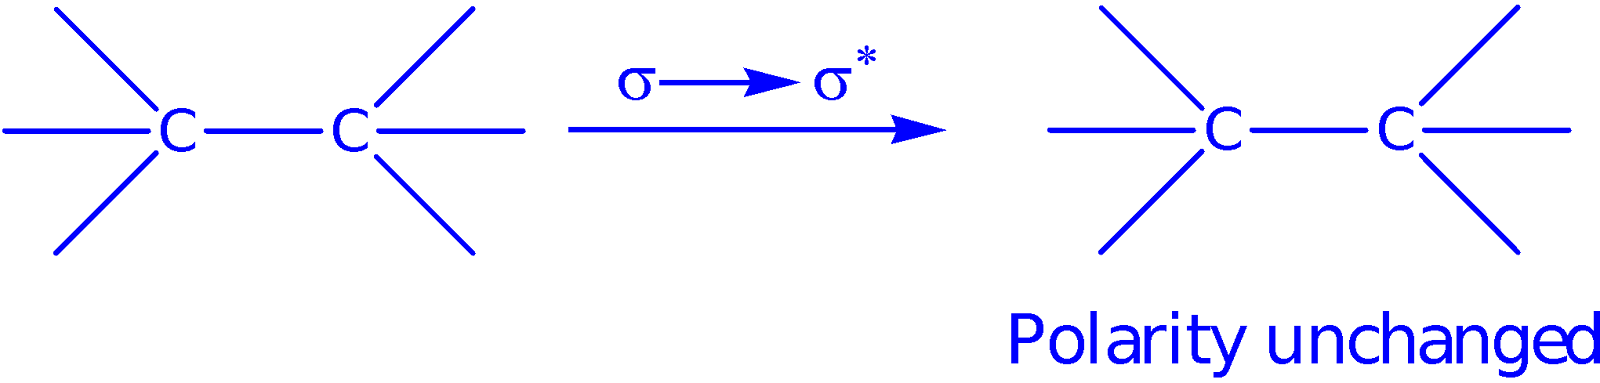
In saturated compounds (no atom with lone pair of electrons though) transition doesn’t change polarity much. Thus solvent effect is not seen.
Impurities
Impurities in the solvent affect the result in UV-Vis spectroscopy. The impurity will absorb light hence the absorbance is exaggerated. This is
why commercial absolute ethanol should not be used to prepare sample solution as it contains benzene as impurity which strongly absorbs
light in the UV region.
why commercial absolute ethanol should not be used to prepare sample solution as it contains benzene as impurity which strongly absorbs
light in the UV region.
Nature of the absorption band
The solvents used in sample preparation will absorb radiation at some specific wavelength. So, radiation of that wavelength becomes
unavailable for spectral studies. For example, chloroform will strongly absorb radiation of below 245 nm. Thus this solvent can’t be used in
a sample that will be run at a wavelength lower than 245 nm. The table below shows the minimum wavelength at which the solvent can be
used to make sample solution. For example, methanol should not be used if the sample is to be run at wavelength lower than 203 nm.
Solvents
|
Minimum wavelength for 1 cm cell, nm
|
Solvents
|
Minimum wavelength for 1 cm cell, nm
|
Acetonitrile
|
190
|
Ethanol
|
204
|
Water
|
191
|
Ether
|
215
|
Hexane
|
201
|
Chloroform
|
237
|
Methanol
|
203
|
Carbon tetrachloride
|
257
|
Absorbing groups
There are two types of groups present in a molecule which is responsible for characteristic electromagnetic radiation absorption by the
molecule. These are described below –
molecule. These are described below –
- Chromophore
A chromophore is a chemical group that absorbs light at a specific frequency and so imparts color to a molecule.
It is defined as any isolated covalently bonded group that shows a characteristic absorption in the ultraviolet or visible region.
When a chromophore is attached to a saturated hydrocarbon, produces a molecule that absorbs a maximum of UV or visible energy at
some specific wavelength. Compounds containing a chropmophoric group called a chromogen.
some specific wavelength. Compounds containing a chropmophoric group called a chromogen.
Some chromophores are listed below –
Chromophore
|
Structure
|
Example of molecule
|
λmax
|
Acetylene (carbon-carbon triple bond)
|
Acetylene
|
173
| |
Amide
|
Acetamide
|
<208
| |
Azo
|
Azomethane
|
347
| |
Carbonyl (ketone)
|
Acetone
|
271
| |
Carbonyl (Aldehyde)
|
Acetaldehyde
|
293
| |
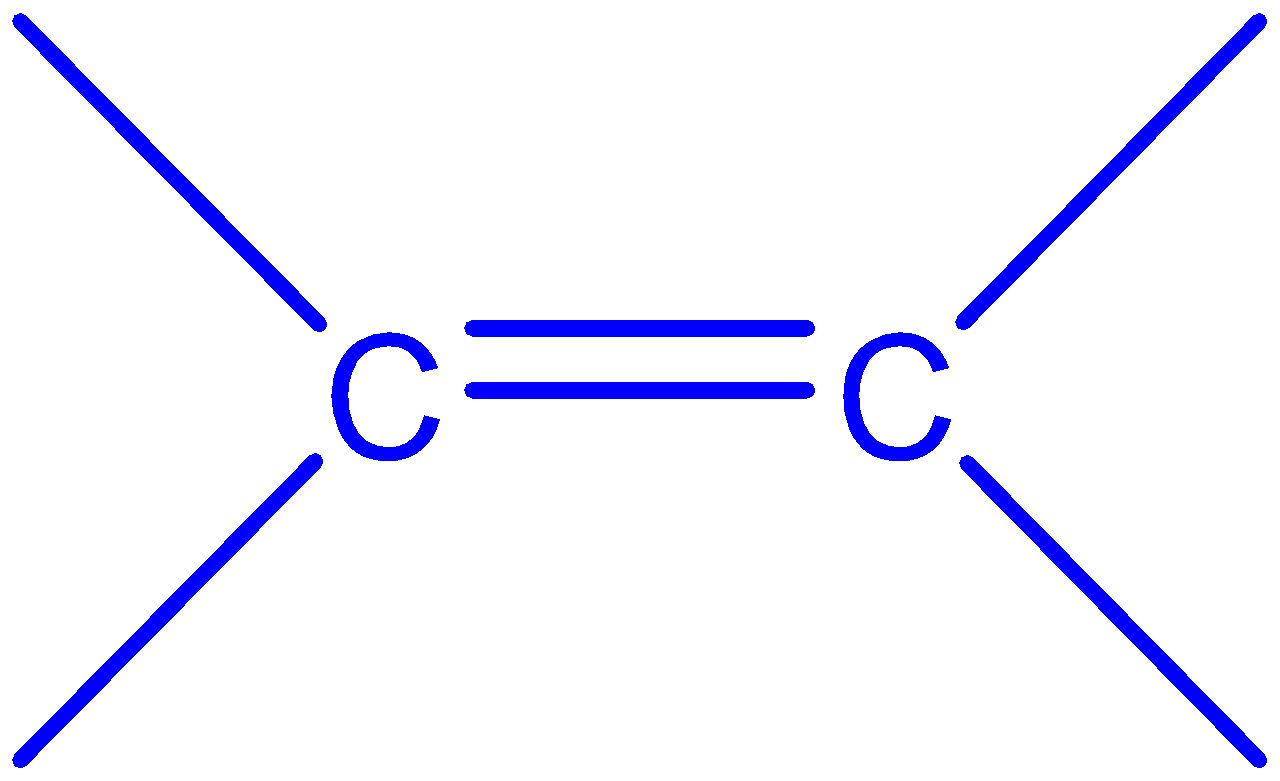
Ethylene (carbon-carbon double bond)
|
Ethylene
|
234
| |
Nitrile
|
Acetonitrile
|
<160
|
A compound may contain two or more chromophores and then the relative position of the chromophores will determine the absorption of
radiation.
radiation.
Chemical structure of beta-carotene. The eleven conjugated double bonds that form the chromophore of the molecule are highlighted in red.

- Auxochrome:
An auxochrome is a group of atoms attached to a chromophore which modifies the ability of that chromophore to absorb light. They
themselves fail to produce the colour; but when present along with the chromophores in an organic compound intensifies the colour of the
chromogen.
themselves fail to produce the colour; but when present along with the chromophores in an organic compound intensifies the colour of the
chromogen.
Auxochrome group contains at least one atom with lone pair of electrons. Examples include the hydroxyl group (-OH), the amino group (-NH2),
the aldehyde group (-CHO), ─NHR, ─NR2.
the aldehyde group (-CHO), ─NHR, ─NR2.
Benzene shows absorption maximum at 255 nm whereas aniline at 280 nm.
 =255 nm
 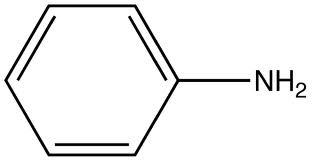 = 280 nm
M/A: They have lone pair electrons that interferes with the chromophores electron transition system i.e. with the electronic localization. This affects the
conjugation system of the compound and causes the shipment of the λmax as well as ϵmax to the higher value. Higher the conjugation higher the
shipment.
conjugation system of the compound and causes the shipment of the λmax as well as ϵmax to the higher value. Higher the conjugation higher the
shipment.
Terminologies describing effects of solvent, chromophores and auxochromes
Absorption and intensity shifts


- Bathochromic shift or Red shift: It is the displacement/shift of λmax (absorption maximum) towards longer wavelength. This may occur
due to solvent effect, conjugation or auxochrome addition.
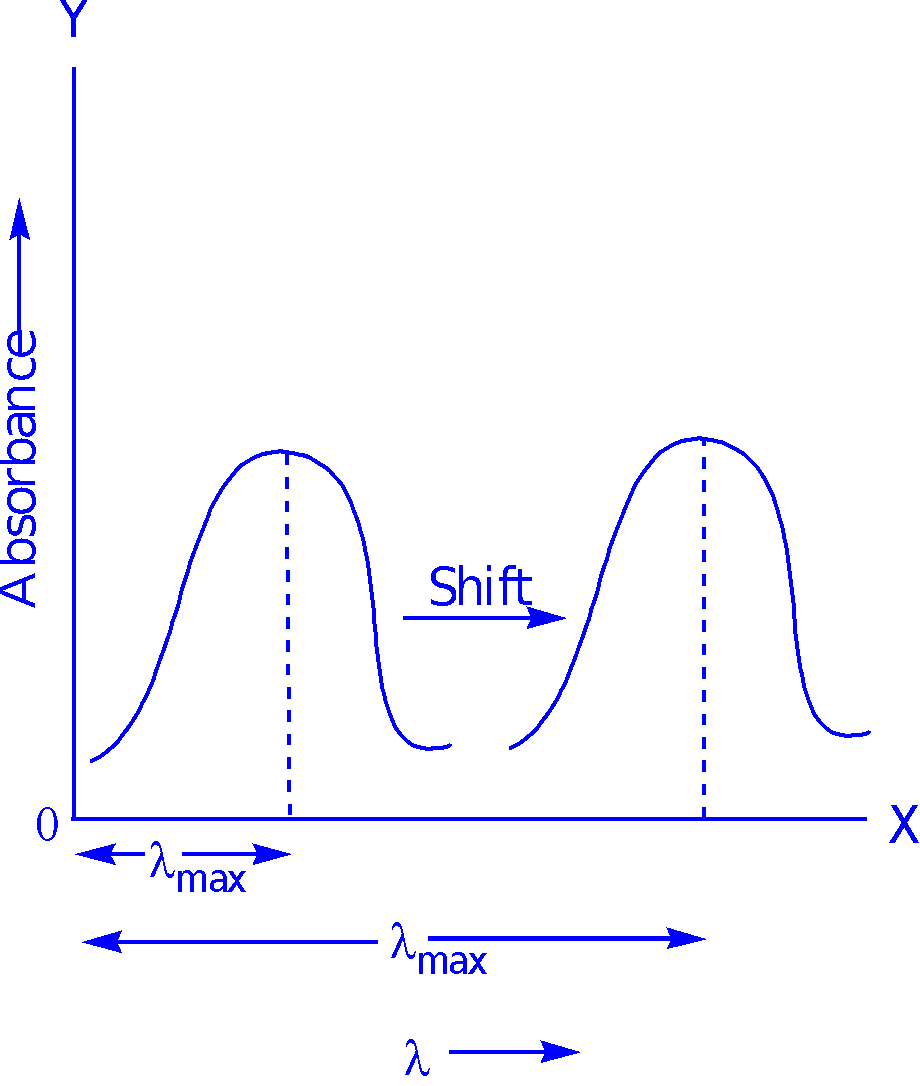
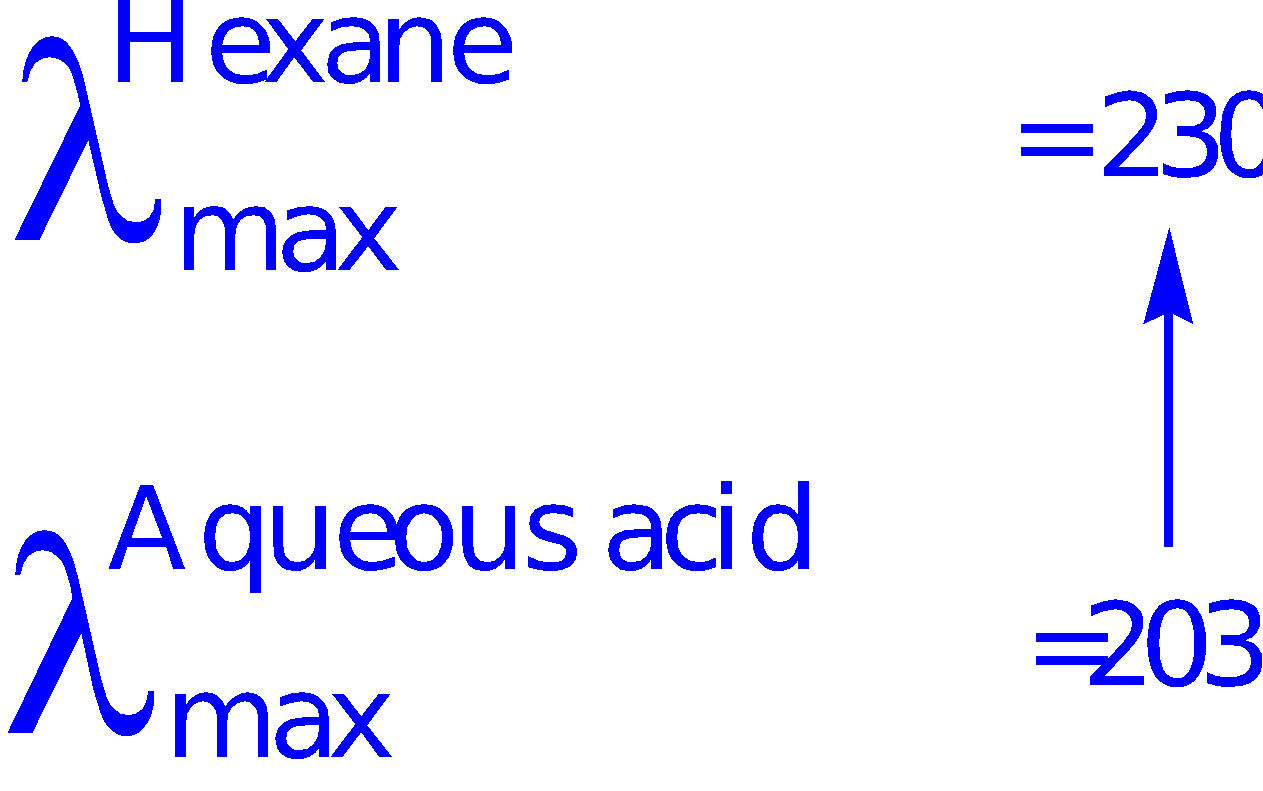
It is known as red shift. Following is an example of this effect.
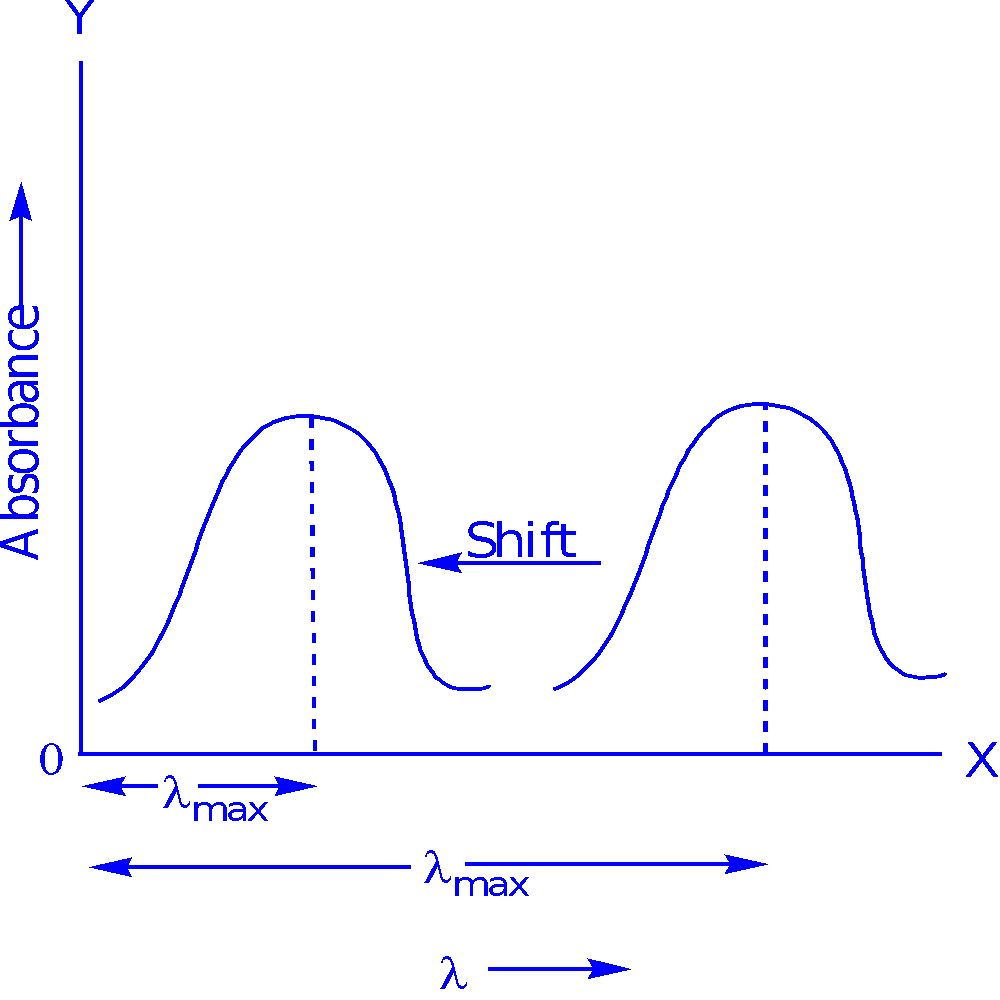
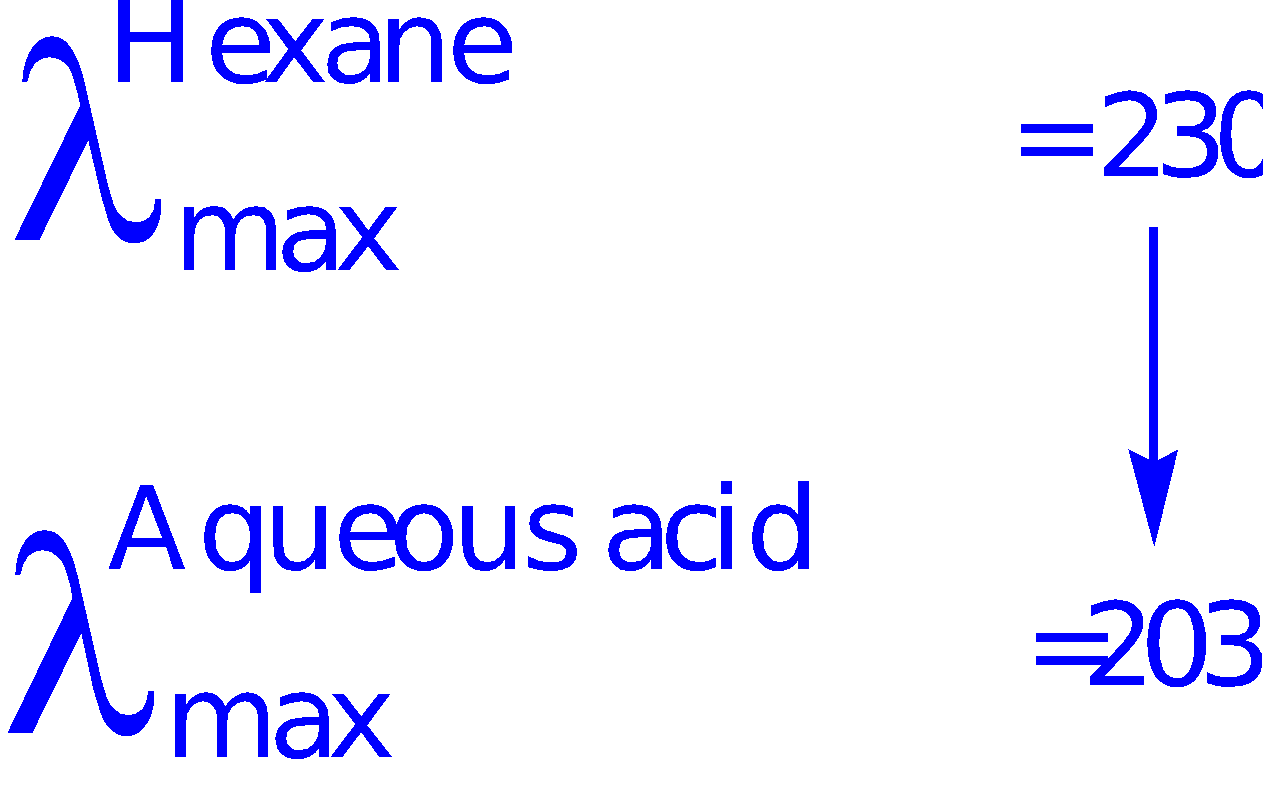
- Hypsochromic shift or Blue shift: it is the displacement of λmax towards the shorter wavelength. This is usually due to solvent effect.
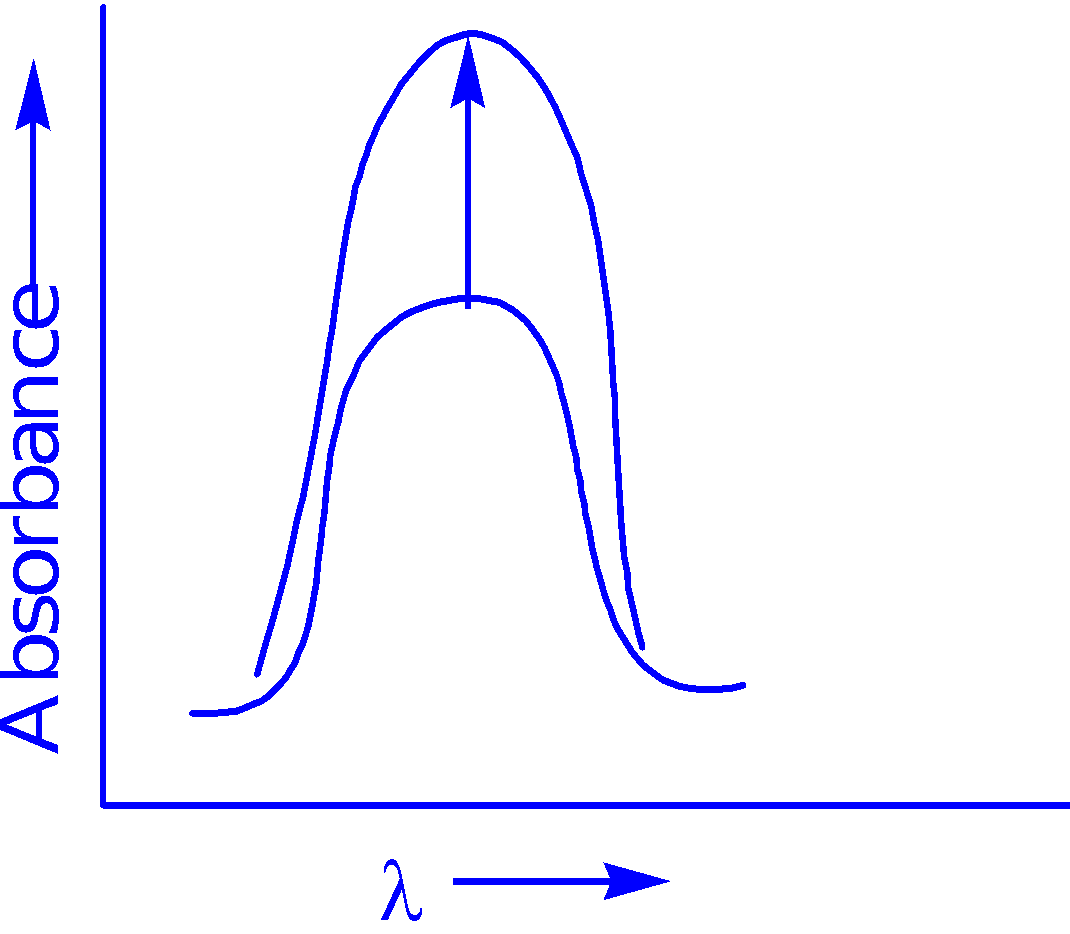
- Hyperchromic effect: It is the effect of increased intensity of radiation absorption by the molecule.
 |
Pyridine 2-methyl pyridine

λmax = 257 nm λmax = 260 nm
ε = 2750 ε = 3560
|
When absorption intensity (ε) of a compound is increased, it is known as hyperchromic shift.
If auxochrome introduces to the compound, the intensity of absorption increases.
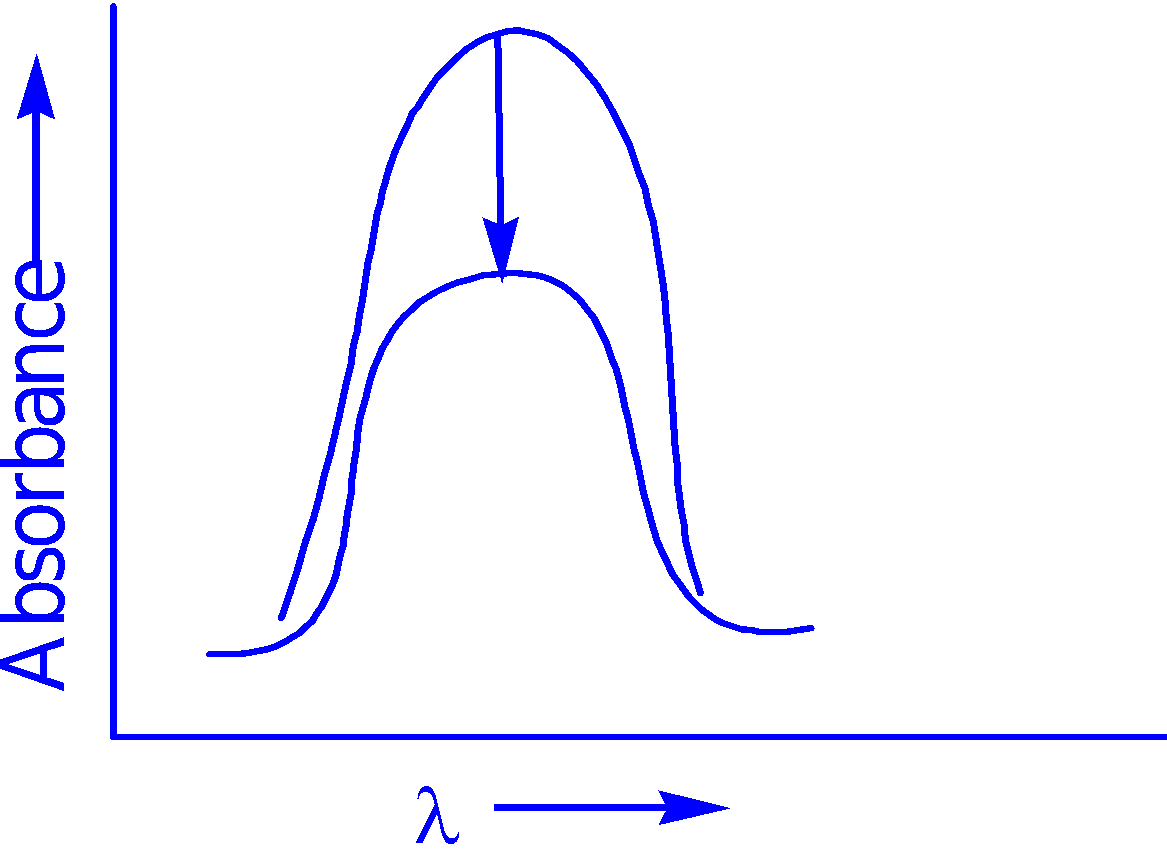
- Hypochromic effect: It is the effect of decreased intensity of radiation absorption by the molecule.
When absorption intensity (ε) of a compound is decreased, it is known as hypochromic shift.
 |
Naphthalene 2-methyl naphthalene

ε = 19000 ε = 10250
|
Vacuum ultraviolet region
Oxygen of atmosphere absorbs UV light of below 200 nm. So it is difficult to analyze a sample by running it at wavelength below 200 nm.
If we want to measure absorption of UV radiation below 200 nm we must remove all the air from the instrument.
If we want to measure absorption of UV radiation below 200 nm we must remove all the air from the instrument.
Thus vacuum is used. So the UV radiation below 200 nm is known as vacuum ultraviolet region.
This region is relatively uninformative as it excites the σ electrons. Above this region, π electrons are excited. The double and triple bonds are
comparatively more informative in the analysis of a compound.
Explanation of electronic transitions in polyenes
comparatively more informative in the analysis of a compound.
Explanation of electronic transitions in polyenes
Compound
|
λmax (nm)
|
175
| |
217
| |
256
| |
290
| |
334
| |
364
|
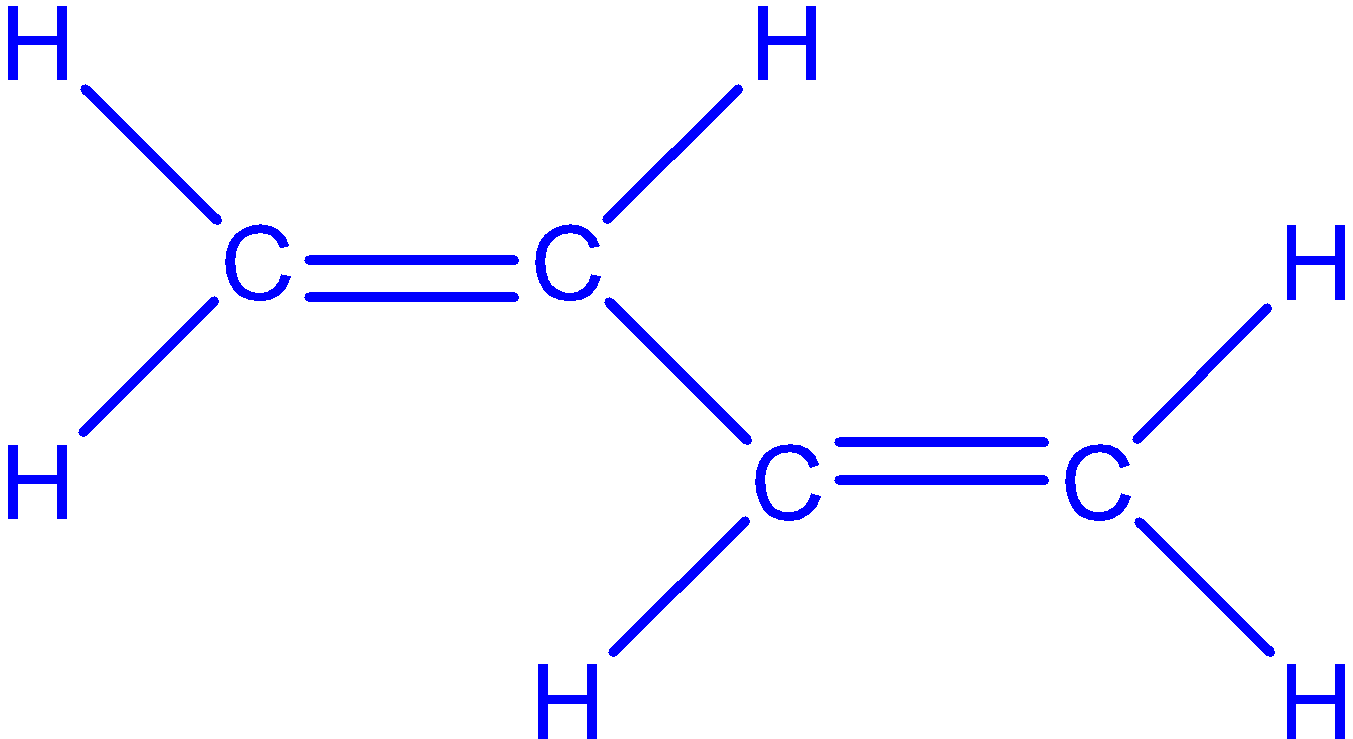
As we can see that, ethylene with only one double bond show most absorption at 175nm, whereas 1,3-butadiene show most absorption at 217
nm. Generally the longer the conjugated system the longer is the wavelength of maximum absorption. For example, β-carotene contains 11
double bonds and show maximum absorption at 451 nm (visible range).
nm. Generally the longer the conjugated system the longer is the wavelength of maximum absorption. For example, β-carotene contains 11
double bonds and show maximum absorption at 451 nm (visible range).
When two atomic orbitals are combined, two molecular orbitals are produced. One is of high energy. This is the unstable molecular orbital
called the anti-bonding orbital. Another is of lower energy and this is the stable orbital. Electrons are present in the stable orbital.
called the anti-bonding orbital. Another is of lower energy and this is the stable orbital. Electrons are present in the stable orbital.

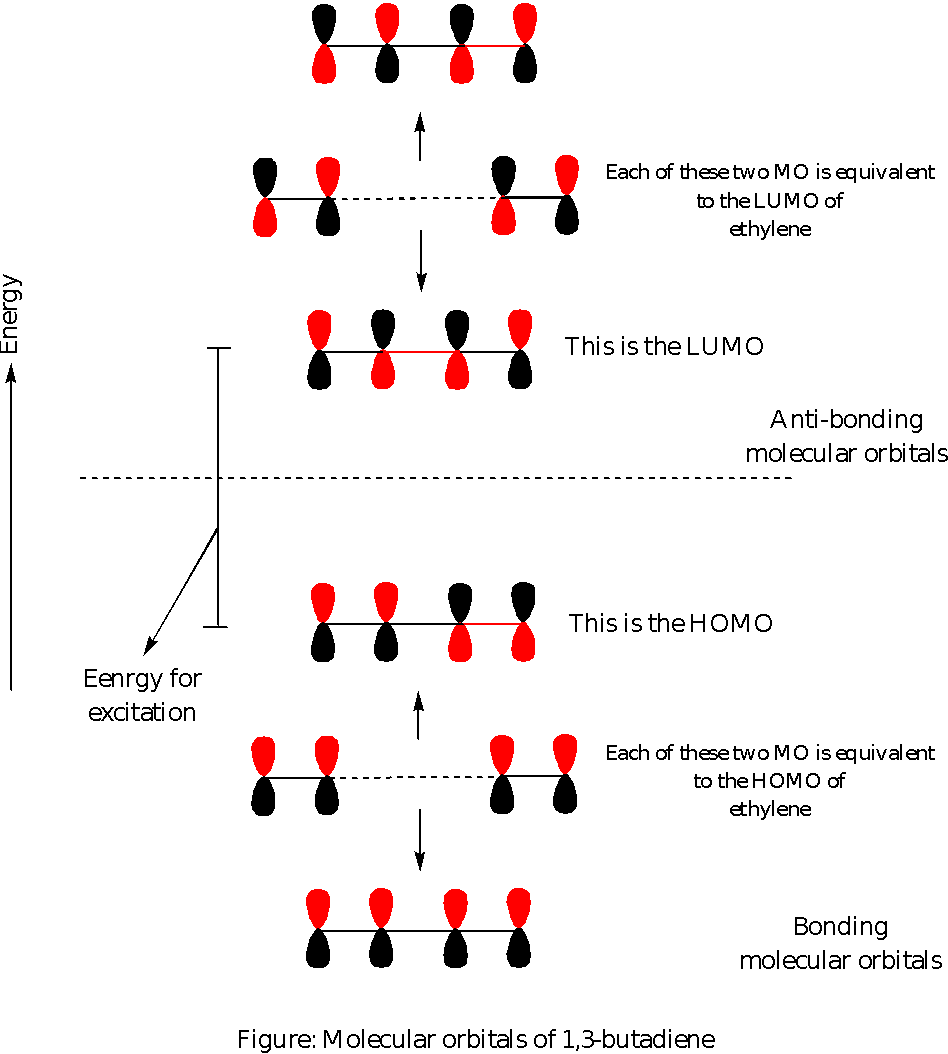
Below is the molecular orbitals of 1,3-butadiene. There are two double bonds in this molecule. Each double bond forms two molecular
orbital – one bonding orbital and one anti-bonding orbital.
orbital – one bonding orbital and one anti-bonding orbital.
The two bonding orbitals of the two double bonds combine to form two molecular orbitals. Among them one is higher in energy than ethylene
molecule and another is lower. The higher energy molecular orbital is the HOMO.
molecule and another is lower. The higher energy molecular orbital is the HOMO.
Similarly, the two anti-bonding orbitals of two double bonds will produce two new molecular orbitals. One of them will be lower in energy
than the excited ethylene molecule and another will be higher in energy than excited ethylene molecule (excited is the keyword – in HOMO
determination we took the molecular orbital that was higher in energy than the ground state ethylene molecule, not excited ethylene molecule).
Among the two the molecular orbital with lower energy than the excited ethylene molecule is the LUMO. One should remember that
anti-bonding molecular orbitals are normally unoccupied and becomes occupied when electrons are excited.
As we can see that the energy difference between LUMO and HOMO of 1,3-butadiene will lower than that of ethylene. (Ethylene has only
one anti-bonding orbital which is the LUMO for ethylene, 1,3-butadiene has two anti-bonding orbitals where the one which has lower energy
than LUMO of ethylene is the LUMO of 1,3-butadiene).
one anti-bonding orbital which is the LUMO for ethylene, 1,3-butadiene has two anti-bonding orbitals where the one which has lower energy
than LUMO of ethylene is the LUMO of 1,3-butadiene).
As the double bonds/conjugation increases, so the energy difference between LUMO and HOMO decreases (e.g. in ethylene the difference is
176 kcal/mol and in 1,3-butadiene the difference is
131 kcal/mol). Thus increase of double bonds decrease energy required for absorption.
176 kcal/mol and in 1,3-butadiene the difference is
131 kcal/mol). Thus increase of double bonds decrease energy required for absorption.

Instrumentation
Spectrometer
Spectrometer is an instrument that is used to measure a physical property over a specific region of the spectrum of that property.
The physical property is usually the intensity of light but other properties can also be used. For example in mass spectrometer, relative
abundance of particles is measured over mass-to-charge ratio.
abundance of particles is measured over mass-to-charge ratio.
Simply spectrometer is any instrument used to measure spectrum.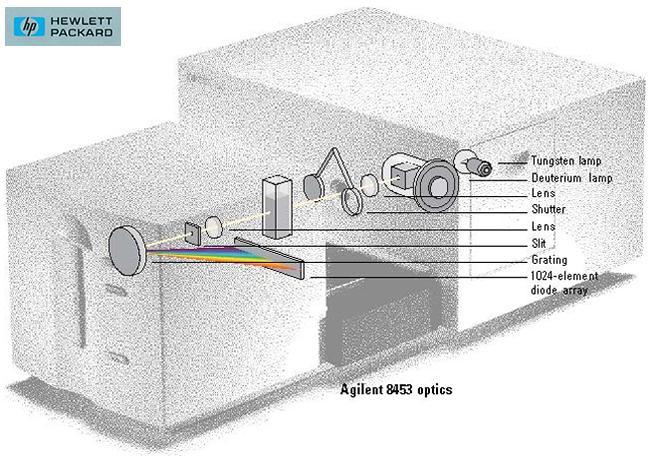
Spectrophotometer
A spectrophotometer is an instrument used to measure the intensity of light over a specific region of the electromagnetic spectrum.
In another words, a spectrophotometer is a spectrometer with a photomultiplier that is used to detect light and determine its intensity as a
function of wavelength.
function of wavelength.
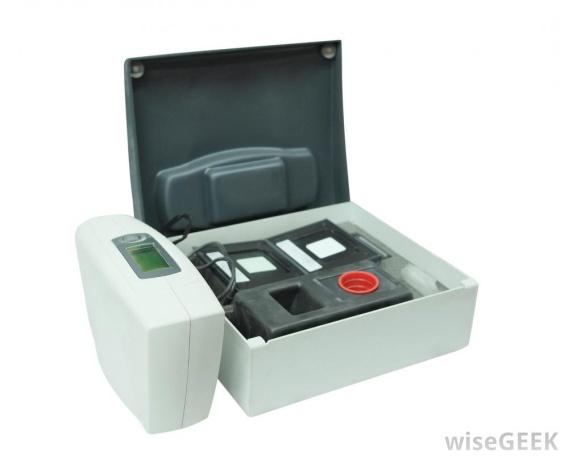
Colorimeter
A colorimeter is a spectrophotometer which is designed to detect only the absorption at the visible region i.e. it will measure the intensity of
light at the visible region of the electromagnetic spectrum.
light at the visible region of the electromagnetic spectrum.
Fig: Colorimeter
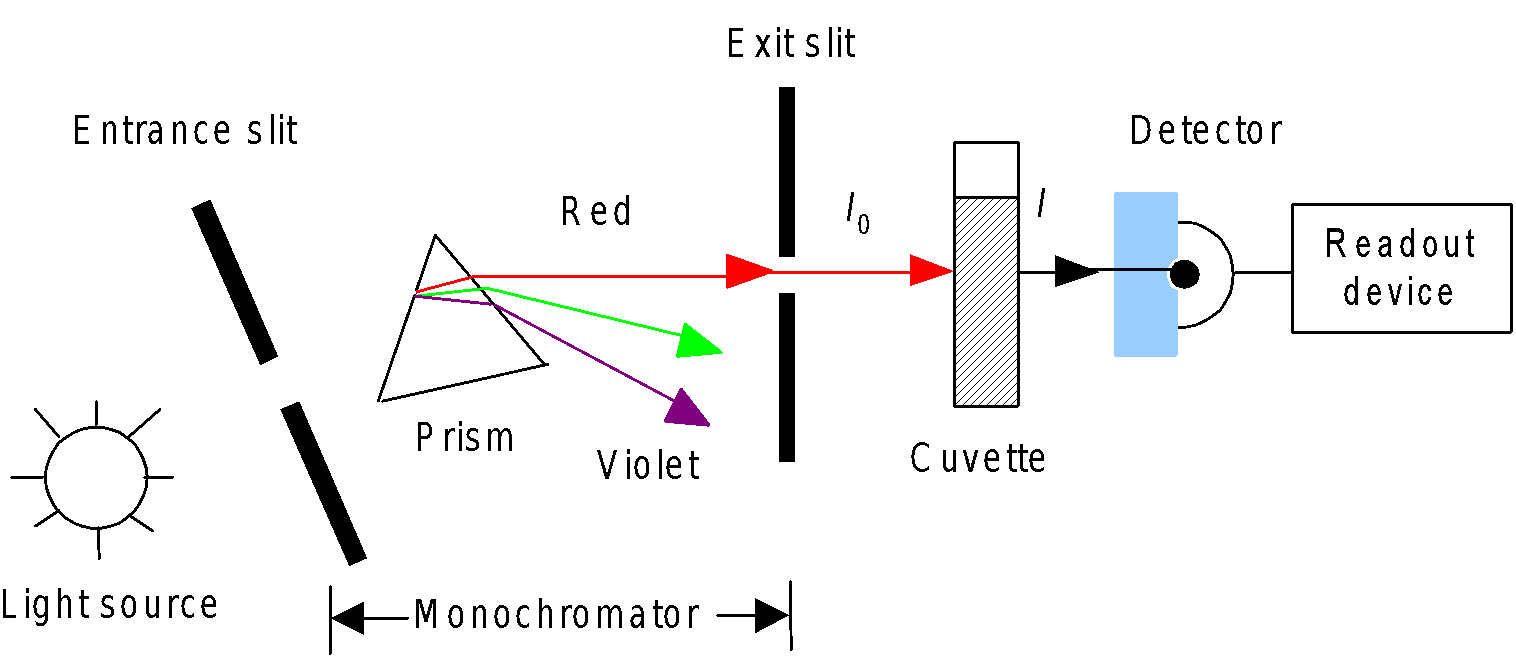
Parts of the UV-Visible spectrophotometer:
Basic Parts
- A Stable and cheap radiant energy source.
- A monochromator, to break the polychromatic radiation into component wavelength (or) bands of wavelengths.
- Transport vessels (cuvettes), to hold the sample.
- A Photosensitive detector and an associated readout system.

Fig: Basic Parts of spectrophotometer
The UV-visible spectrometer is a spectrophotometer designed to work in the UV and visible range of the electromagnetic spectrum.
It consists of following parts –
- Radiation source: A source for UV and visible light is perquisite. A UV-visible spectrophotometer works at around 190-800 nm range.
Usually two sources are used – - Hydrogen or deuterium discharge lamp: It emits electromagnetic radiation of
185-365 nm wavelengths. - Tungsten lamp (6V or 12V): It emits electromagnetic radiation of 350-800 nm.
Since, none of them produces the complete range of the target spectrum. They are used simultaneously.
Requirements for radiation source
1. The radiation should be continuous
2. Its spectrum should include all the wavelengths required for the analysis.
3. The power of the beam should be such that, the solution can transmit some or all of the radiation energy at all wavelengths.
4. The power of the beam must remain constant throughout the measurement.
Various UV radiation sources are as follows
a. Deuterium lamp
b. Hydrogen lamp
c. Tungsten lamp
d. Xenon discharge lamp
e. Mercury arc lamp
b. Hydrogen lamp
c. Tungsten lamp
d. Xenon discharge lamp
e. Mercury arc lamp
RADIANT ENERGY SOURCES
Materials which can be excited to high energy states by a high voltage electric discharge (or) by electrical heating serve as excellent radiant energy sources.
Sources of Ultraviolet radiation: Most commonly used sources of UV radiation are the hydrogen lamp and the deuterium lamp. Xenon lamp may also be used for
UV radiation, but the radiation produced is not as stable as the hydrogen lamp.
UV radiation, but the radiation produced is not as stable as the hydrogen lamp.
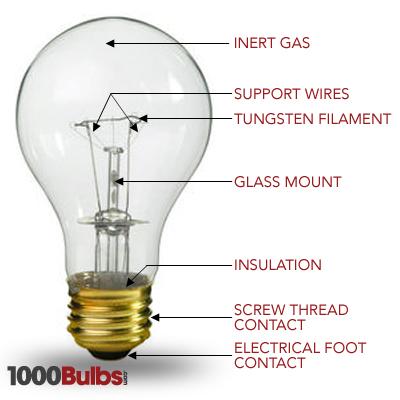
Sources of Visible radiation: “Tungsten filament” lamp is the most commonly used source for visible radiation. It is inexpensive and emails continuous radiation
in the range between 350 and 2500nm. “Carbon arc” which provides more intense visible radiation is used in a small number of commercially available
instruments.
in the range between 350 and 2500nm. “Carbon arc” which provides more intense visible radiation is used in a small number of commercially available
instruments.
Sources of IR radiation: “Nernst Glower” and “Global” are the most satisfactory sources of IR radiation. Global is more stable than the nearest flower.
For Visible region
Tungsten filament lamp
- Use for region 350nm to 2000nm.
- These measure most effectively in the visible region from 320 - 1100 nm
- Instruments that only use Tungsten halogen lamps as the light source will only measure in the visible region.
For ultra violet region
Hydrogen discharge lamp Fig. Tungsten filament lamp
- Consist of two electrode contain in Hydrogen filled silica envelop.
- Gives continuous spectrum in region 185-380nm. above 380nm emission is not continuous
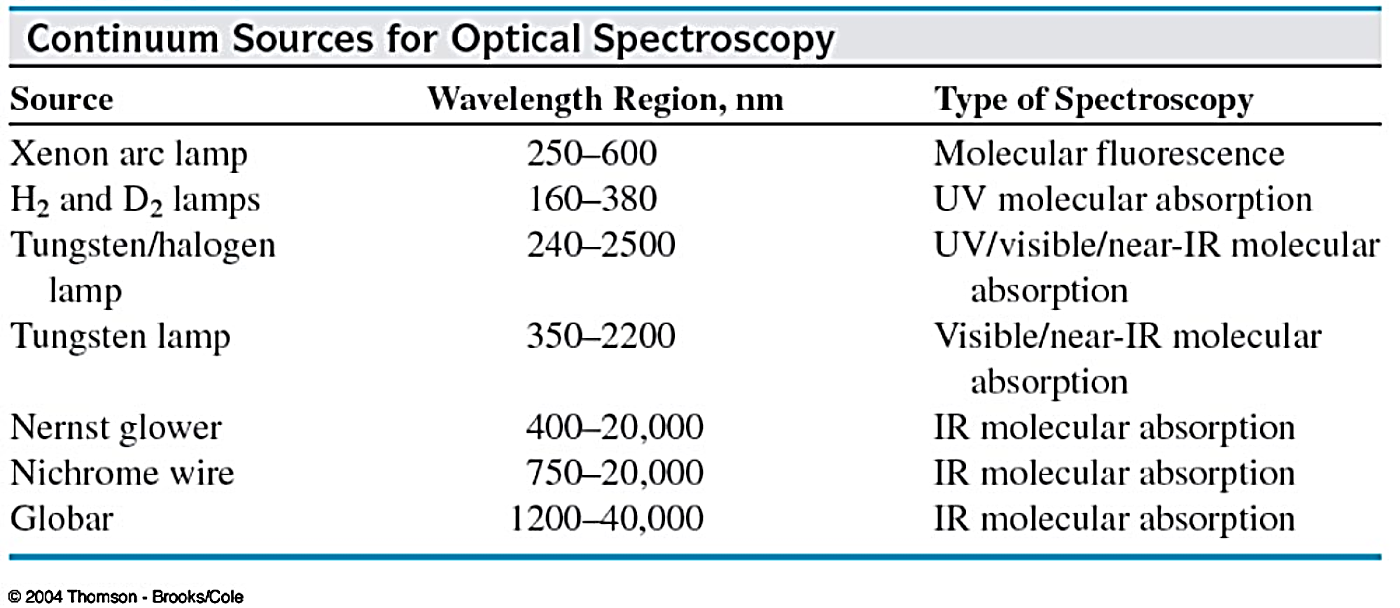
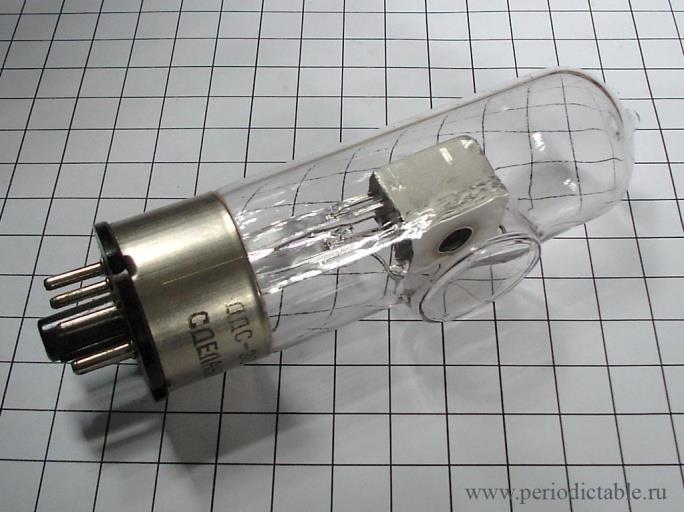
Fig. Hydrogen discharge lamp

Deuterium lamps:
- Deuterium arc lamps measure in the UV region 190 - 370 nm
- As Deuterium lamps operate at high temperatures, normal glass housings cannot be used for the casing. Instead, a fused quartz, UV glass, or magnesium
fluoride envelope is used. - When run continuously typical lamp life for a Deuterium lamp is approximately 1000 hours, however this can be extended by up to a factor of three using PTR
technology. - Deuterium lamps are always used with a Tungsten halogen lamp to allow measurements to be performed in both the UV and visible regions.
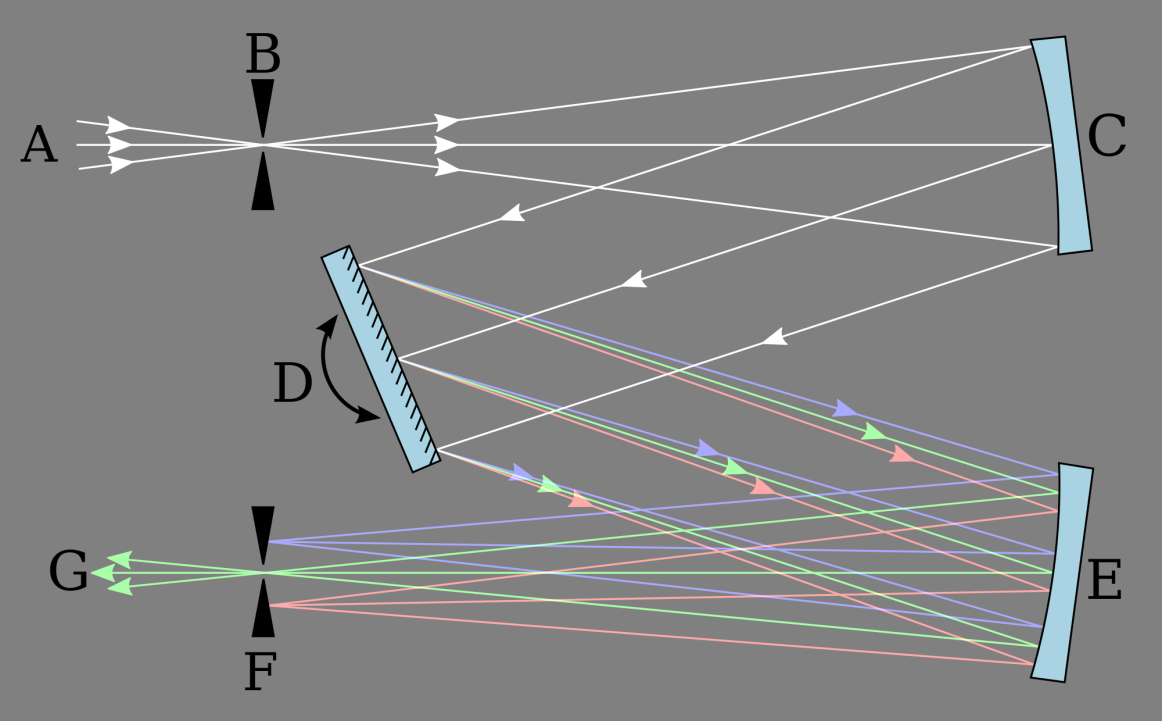
- Monochromator: The monochromator disperses the polychromatic light by means of a prism or grating (in grating there is a flat
surface having alternating reflective and
non-reflective portions). The desired monochromatic light is obtained by changing the angular position of prism or grating and this
monochromatic light is allowed to pass to sample.
Monochromatic Light: The light having a single wavelength and frequency i.e. the light that vibrates at a single wavelength.
Polychromatic Light: The light having several colours i.e. light having electromagnetic radiation of several wavelengths.

The light must be monochromatic as extinction coefficient is variable with wavelength.
2. WAVELENGTH SELECTORS
Wavelength selectors are of two types.
- Filters: “Gelatin” filters are made of a layer of gelatin, colored with organic dyes and sealed between glass plates.
- Monochromators: A monochromator resolves polychromatic radiation into its individual wavelengths and isolates these wavelengths into very narrow bands.
The essential components of a monochromator are. - Entrance slip-admits polychromatic light from the source
- Collimating device – Collimates the polychromatic light onto the dispersion device.
- Wavelength resolving device like a PRISM (or) a GRATING
- A focusing lens (or) a mirror
- An exit slip – allows the monochromatic beam to escape.
The kinds of the resolving element are of primary importance
PRISMS: A prism disperses polychromatic light from the source into its constituent wavelengths by virtue of its ability to reflect different wavelengths to a different
extent;
The degree of dispersion by the prism depends on upon
extent;
The degree of dispersion by the prism depends on upon
- The optical angle of the Prism (usually 600)
- The material of which it is made
Two types of Prisms are usually employed in commercial instruments. Namely, 600cornu quartz prism and 300 Littrow Prism.
GRATINGS: Gratings are often used in the monochromators of spectrophotometers operating ultraviolet, visible and infrared regions.
- Sample compartment: The sample is kept in a small tube of square cross section called “cuvette” i.e. the tube has four sides.
There are two opposite sides through which the light is supposed to pass (i.e. these two sides form the optical window). The other two sides
are usually unclear (in some cases, all four sides may be clear) and used for handling. The cuvette (at least the optical window of the cuvette)
is made of glass, plastic or fused quartz. The glass and plastic cuvettes are used to measure at visible spectrum while quartz cuvettes are
used to measure at ultraviolet spectrum. The length of the optical window is usually 1cm.
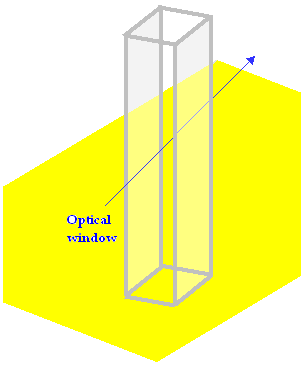
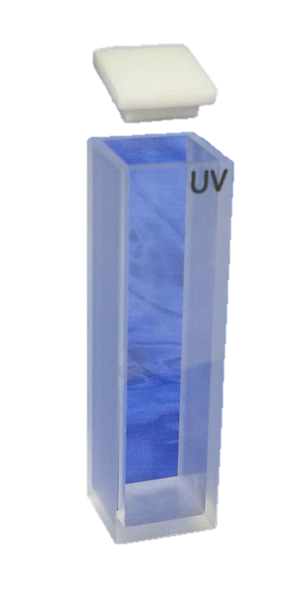
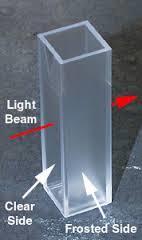
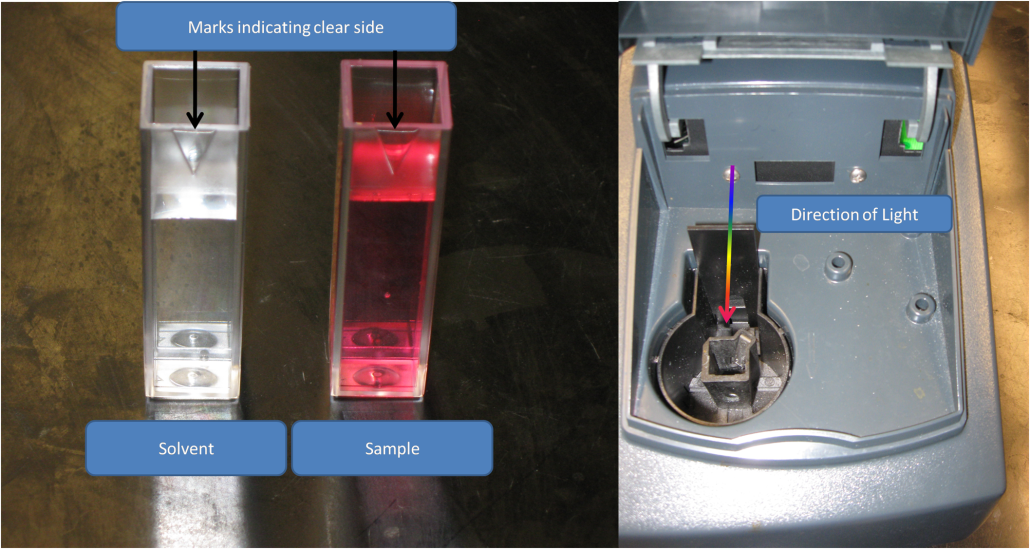
Fig. cuvette
- Detector: The detector converts the radiant energy into electrical energy.
Most detectors depend on the photoelectric effect. The current is then proportional to the light intensity and therefore a measure of it.
Important requirements for a detector include
- High sensitivity to allow the detection of low levels of radiant energy
- Short response time
- Long term stability
- An electric signal which easily amplified for typical readout apparatus.
In spectrophotometer the detector is a photomultiplier tube. It consists of following parts –
a. One cathode (electron emitter): It emits electrons when the photon of radiation strikes it.
b. Several electrodes called dynodes: After the cathode there are a number of electrodes called the dynodes. The dynode next to cathode is
more positive than cathode and produces several electrons for each electron striking it. The dynode next to the 1st dynode is even more
positive and it also produces more electrons. By the time electrons are collected at anode, for each photon about 106-107 electrons are generated
.
more positive than cathode and produces several electrons for each electron striking it. The dynode next to the 1st dynode is even more
positive and it also produces more electrons. By the time electrons are collected at anode, for each photon about 106-107 electrons are generated
.
c. One anode: It receives the electrons generated on the way. The resulting current is then measured.

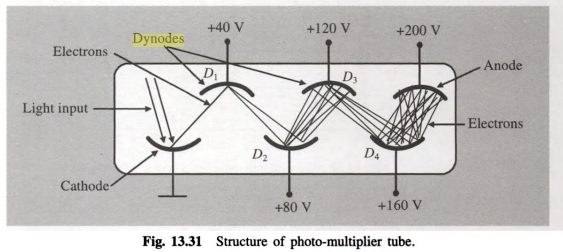

Fig. Photomultiplier tube
- Recorder: From the measurement of current obtained from transmitted light, it plots a graph of absorbance versus wavelength.
The chart recorder
Chart recorders usually plot absorbance against wavelength. This particular substance has what are known as absorbance
peaks at 255 and 395 nm. How these arise and how they are interpreted are discussed on another page.
peaks at 255 and 395 nm. How these arise and how they are interpreted are discussed on another page.
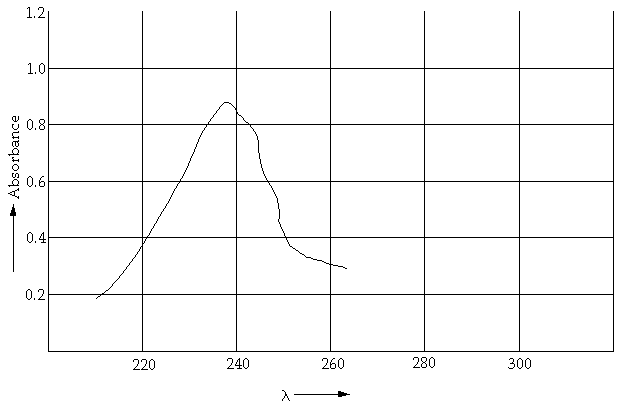
Fig. The output of chart recorder.
Working principle
Firstly, the machine is started. The machine will run and take a reading of the intensity of the radiation source. This is the incident light
intensity.
intensity.

The sample is placed inside the instrument in cuvette. Light is generated by the radiation source and then passed through the monochromator.
The monochromatic light is passed through the sample and then the intensity of the transmitted light is measured in the detector. From the
intensity of the incident light and intensity of the transmitted light the computer will calculate and show the absorbance.
The monochromatic light is passed through the sample and then the intensity of the transmitted light is measured in the detector. From the
intensity of the incident light and intensity of the transmitted light the computer will calculate and show the absorbance.
Then the blank/reference (sample solution minus the sample molecules) is placed in the instrument.
The intensity of the transmitted light is measured again. From these two values the relative intensities light before passing the sample
molecules and after passing the sample molecules can be determined.
molecules and after passing the sample molecules can be determined.
So basically there are two measurements involved.
In some single beam spectrophotometer a “zeroing” method is used where the absorbance by the reference is set as baseline value and then
the absorption by the sample is measured relative to it.
the absorption by the sample is measured relative to it.
Double beam spectrophotometer:
In single beam spectrophotometer there is a necessity to make two separate measurements. This has been eliminated with the double beam
spectrophotometer.
spectrophotometer.
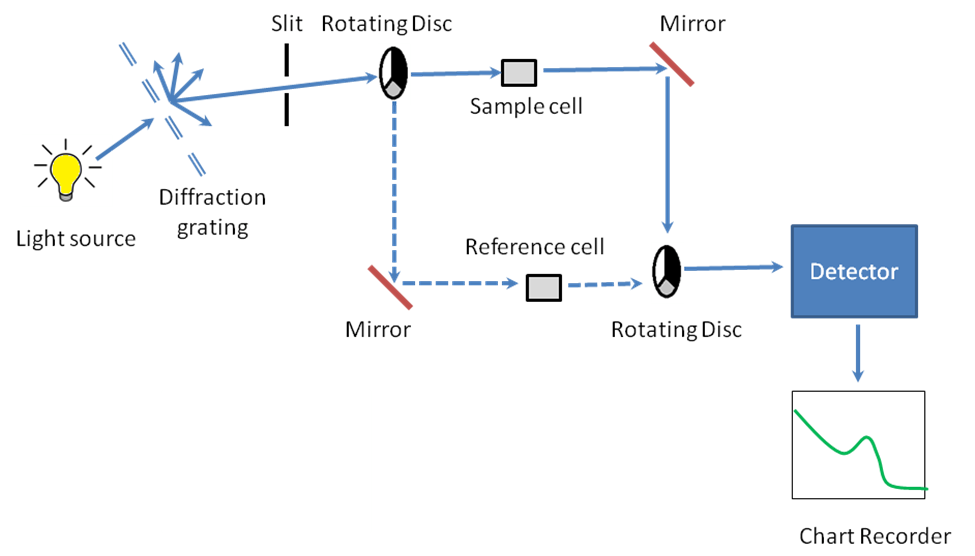
In this instrument the blank (the reference cell) and the sample solution (sample cell) is placed simultaneously in the spectrophotometer. The
light generated by the radiation source is passed through the monochromator and the monochromatic light is split into two beams (this is done
by a rotating disc).
light generated by the radiation source is passed through the monochromator and the monochromatic light is split into two beams (this is done
by a rotating disc).
One beam passes through the reference cell and other passes through the sample cell. Then the transmitted light (whether from reference cell
or sample cell) is sent to the detector. The detector will measure the intensities of the transmitted light. A computer will analyze the intensities
and subtract the intensity of transmitted light from sample cell from the intensity of the transmitted light from reference cell.
or sample cell) is sent to the detector. The detector will measure the intensities of the transmitted light. A computer will analyze the intensities
and subtract the intensity of transmitted light from sample cell from the intensity of the transmitted light from reference cell.
Thus the absorption by the rest of the part of solution is cancelled.
- Single-beam spectrophotometer
- Double-beam spectrophotometer
a) Single beam spectrophotometer
A single-beam instrument uses only single beam of radiation through a single cell. The reference cell is used to set the absorbance scale at
zero for the wavelength to be studied. It is then replaced by sample cell to determine the absorbance of the sample at that wavelength.
zero for the wavelength to be studied. It is then replaced by sample cell to determine the absorbance of the sample at that wavelength.
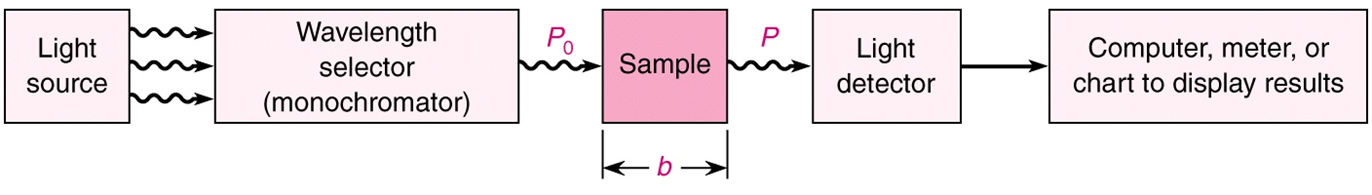
Fig: Single-beam spectrophotometer
b) Double-beam spectrophotometer
A double beam instrument divides the radiation into two beams of equal intensity which are passed through two separate cells. One of the
two cells contains the sample solution, while other, called the reference cell, contains either the pure solvent or a blank solution. Since the
absorption by the sample is automatically corrected for absorption occurring in the solvent, the readout from the instrument is the difference
between amounts of the radiations absorbed in the two cells.

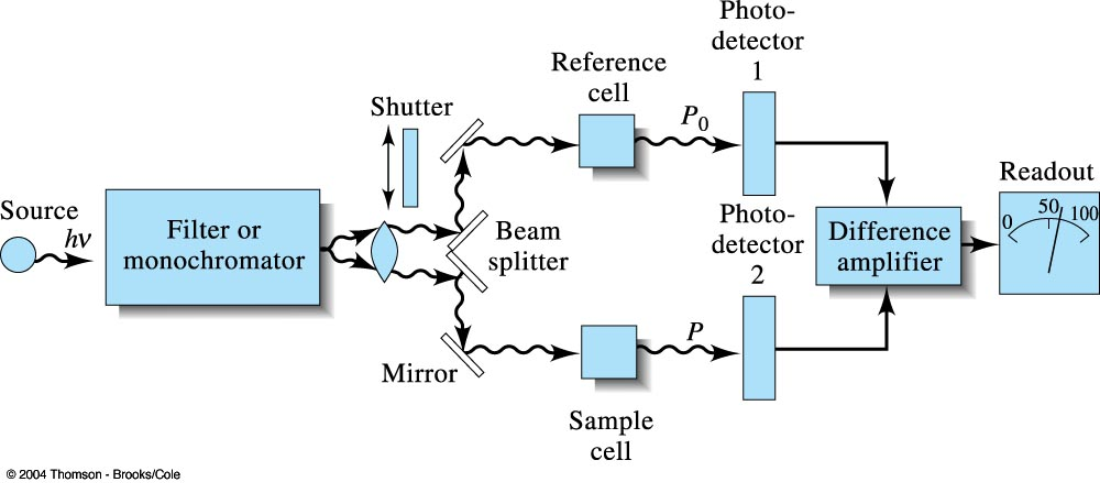

Fig: Double-beam spectrophotometer
Applications of UV spectroscopy
1. Structure elucidation of organic compounds: UV spectroscopy is useful in the structure elucidation of organic molecules,( the presence or
absence of unsaturation, the presence of hetero atoms). From the location of peaks and combination of peaks, it can be concluded that
whether the compound is saturated or unsaturated, hetero atoms are present or not etc.
2. Identification of an unknown compound- An unknown compound can be identified with the help of UV spectroscopy. The spectrum of
unknown compound is compared with the spectrum of a reference compound and if both the spectrums coincide then it confirms the
identification of the unknown substance.
unknown compound is compared with the spectrum of a reference compound and if both the spectrums coincide then it confirms the
identification of the unknown substance.
3. Quantitative analysis: UV absorption spectroscopy can be used for the quantitative determination of compounds that absorb UV radiation.
This determination is based on Beer’s law. A = abc
This determination is based on Beer’s law. A = abc
4. Detection of Impurities: Additional peaks can be observed due to impurities in the sample and it can be compared with that of standard
raw material. Benzene appears as a common impurity in cyclohexane. Its presence can be easily detected by its absorption at 255 nm.
raw material. Benzene appears as a common impurity in cyclohexane. Its presence can be easily detected by its absorption at 255 nm.
5. Qualitative analysis: In UV absorption spectroscopy identification is done by comparing the absorption spectrum with the spectra of
known compounds. UV absorption spectroscopy is generally used for characterizing aromatic compounds and aromatic olefins.
known compounds. UV absorption spectroscopy is generally used for characterizing aromatic compounds and aromatic olefins.
6. Chemical kinetics: Kinetics of reaction can also be studied using UV spectroscopy. The UV radiation is passed through the reaction cell and
the absorbance changes can be observed.
the absorbance changes can be observed.
7. Molecular weight determination: Molecular weights of compounds can be measured spectrophotometrically by preparing the suitable
derivatives of these compounds.
derivatives of these compounds.
8. As HPLC detector: A UV/Vis spectrophotometer may be used as a detector for HPLC.
9. Detection of extent of conjugation- The extent of conjugation in the polyenes can be detected with the help of UV spectroscopy.
10. Determination of configurations of geometrical isomers- It is observed that cis-alkenes absorb at different wavelength than the
trans-alkenes. The cis-isomer suffers distortion and absorbs at lower wavelength as compared to trans-isomer.
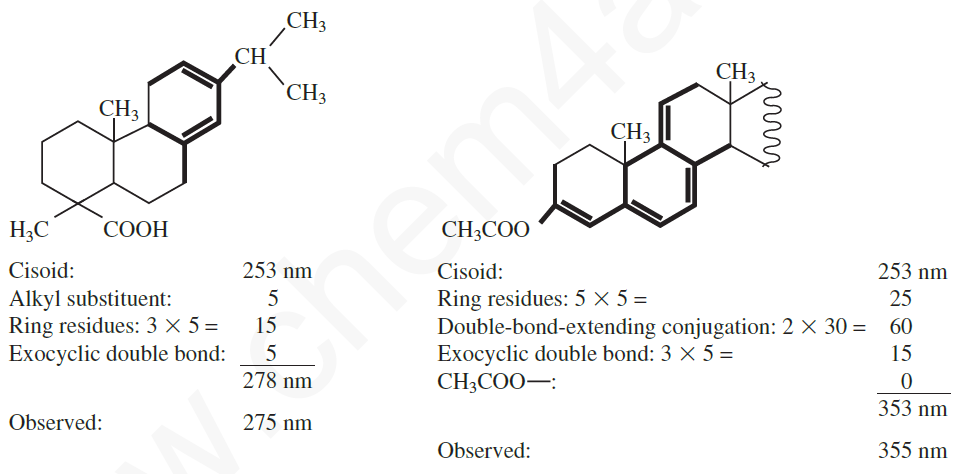
Theoretical determination of λmax of compounds:
In 1941, Robert Burns Woodward first put forward a set of rules to predict the λmax of a given compound in UV-Vis spectroscopy. These rules
were applicable to open chain and 6-membered ring dienes.
were applicable to open chain and 6-membered ring dienes.
Later the rules were modified by Fischer Scott and Louis Fieser. This is known as the Woodward-Fieser rules (This rule works well when the
conjugated system is only 4 double bonds long. When more than four double bonds are present, one must use the Fieser-Kuhn rules instead).
Various types of double bonds in conjugation are:
conjugated system is only 4 double bonds long. When more than four double bonds are present, one must use the Fieser-Kuhn rules instead).
Various types of double bonds in conjugation are:
1. Homoannular dienes: It is a cyclic diene having conjugated doubles bonds in the same ring. e.g. Toluene, Naphthalene.
2. Acyclic dienes: Diene containedvin an open chain syatem. Where the basic unit is butadiene. 
3. Heteroannular dienes: It is a cyclic diene in which double bonds in conjugation are present in different ring.
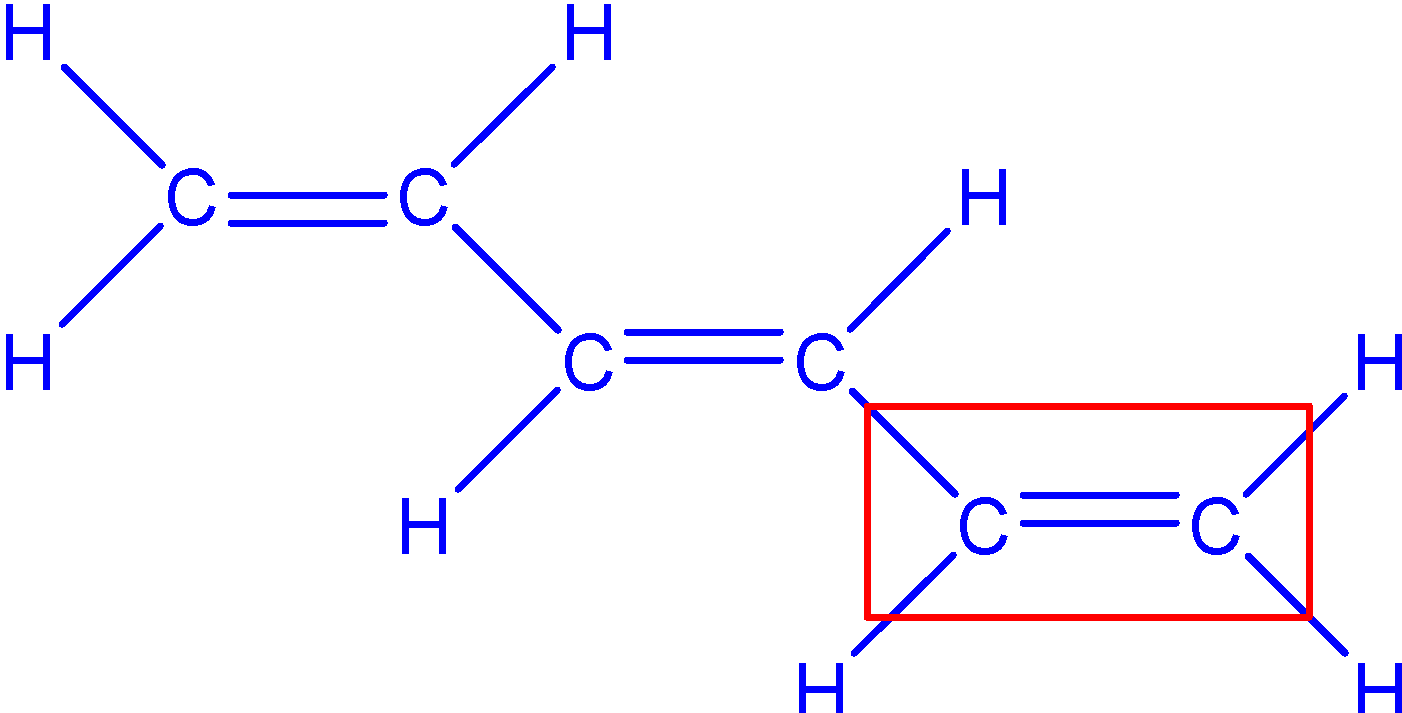
4. Endocyclic conjugated double bond: It is the double bond present in the ring.
5. Exocyclic conjugated double bond: It is a double bond is a double bond, part of the conjugated system and formed by any carbon atom of
any ring but present outside of the ring.
any ring but present outside of the ring.
According to the rules each type of diene or triene system have a fixed value at which absorption takes place.
This constitutes the basic value or parent value.
The contributions made by various alkyl substances or ring residue, double bonded extending conjugation and polar group such as –Cl, -Br, -OR
are added to the basic value to obtain λmax for a particular compound.
are added to the basic value to obtain λmax for a particular compound.
Ring residue is a C-C bond, not a part of the conjugated system; but attached to any one of the carbon atoms of the conjugated poyene system.
The parent values and contribution of different substituents or groups are given below (Conjugated trienes and dienes/solvent
ethanol/pi-pi* transition)
ethanol/pi-pi* transition)
1. Parent Values:
| |
Cyclic conjugated dien or butadiene
|
217nm
|
Acyclic triene
|
245 nm
|
Heteroannular conjugated diene
|
215 nm
|
Homoannular conjugated diene
|
253 nm
|
2. Increment for each substituent:
| |
Alkyl substituent or ring residue
|
5 nm
|
Exocyclic double bond
|
5 nm
|
Double bond extending conjugation
|
30 nm
|
3. Auxochromes
| |
–OR
|
+6 nm
|
–SR
|
+30 nm
|
–BR, -Cl
|
+5 nm
|
-NR2
|
+60 nm
|
-OCOCH3
|
0
|
Modified rules for open chain dienes:
According to the modified rules, calculation can be made as follows –
Such values are listed below –
Class
|
Structure
|
Wavelength value (nm)
|
Parent/base/core
|  |
217
|
A double bond extension of the conjugation
| 
Thus, following structure has the λmax of
 |
30
|
Alkyl group substituent
|
─R
|
5
|
Auxochromic (attached to the chromophore) OX
|
─OH, ─OR
|
6
|
Auxochrome – Acyloxy
Auxochrome – Ester
|   |
0
|
Axochrome – Amine
|  |
60
|
Auxochrome – Halogen (X)
|
Cl, Br
|
5
|
Sulfide
|
SR
|
30
|
Phenyl
| 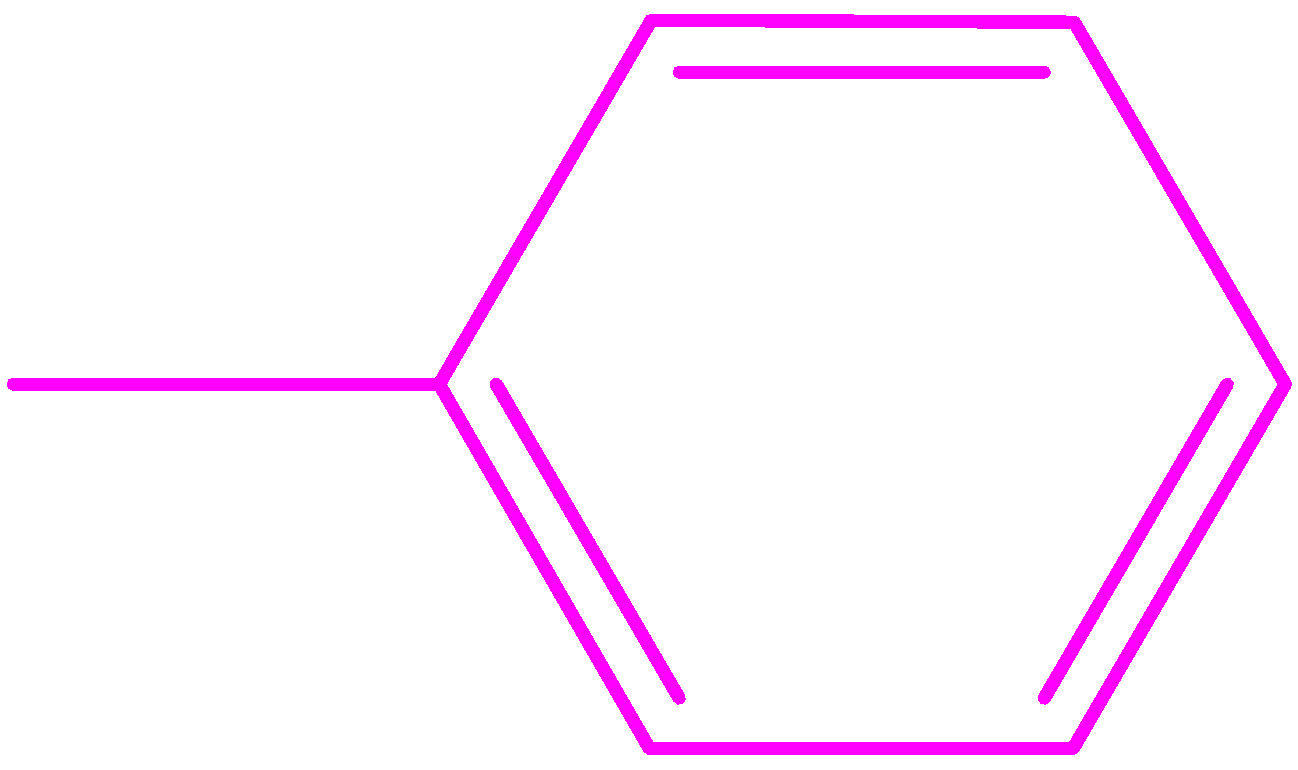 |
60
|
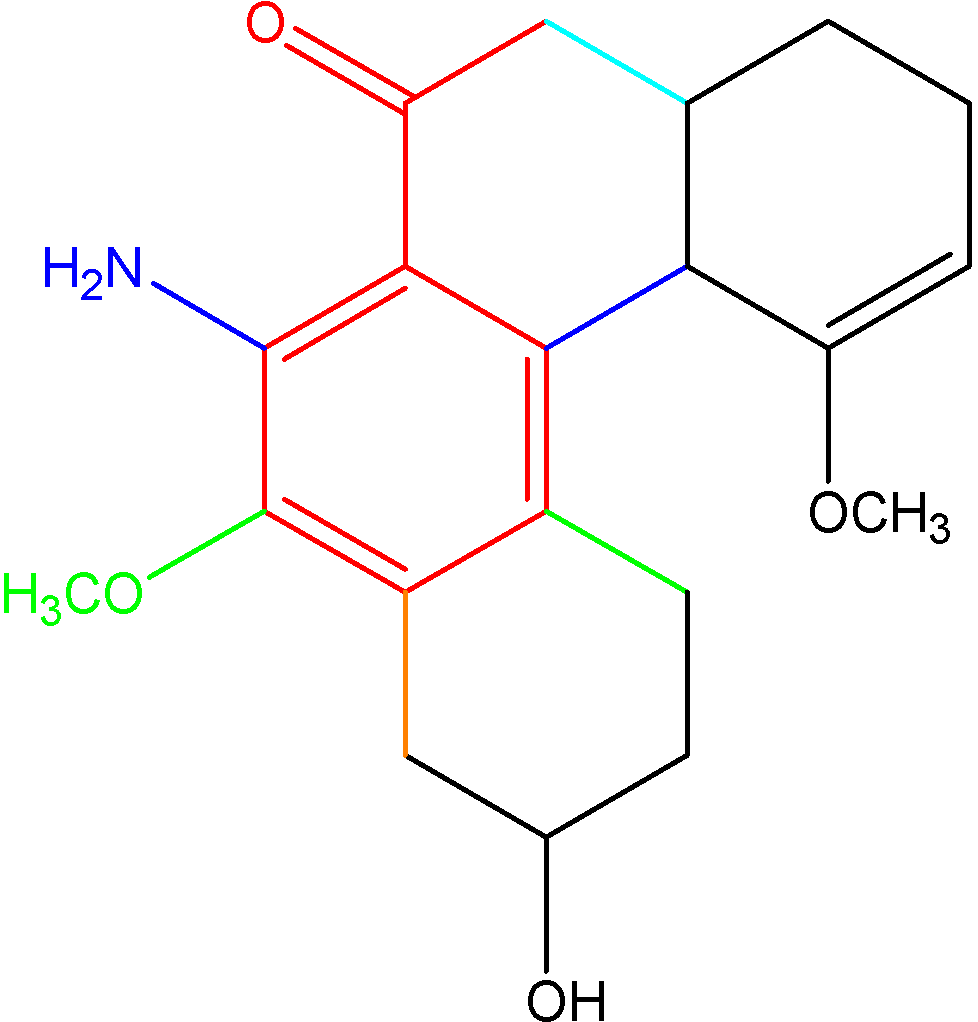
Example explaining the modified rules for open chain dienes:

Here,
Parent value
|
217
|
Double bond extension of the conjugation
|
30
|
One Cl group
|
5
|
One NR2 group
|
60
|
two alkyl group (shown in sky blue and orange)
| |
One OH group
|
6
|
total
|
=328 nm
|
Modified rule for benzoyl derivatives:
Class
|
Structure
|
Wavelength value (nm)
|
Parent/base/core
|  |
|
Alkyl or ring residue on ortho or meta position.
|
3
| |
Alkyl or ring residue on para position.
|
10
| |
OH, OR at ortho or meta position.
|
7
| |
OH, OR at para position.
|
25
| |
NH2 at ortho or meta position.
|
13
| |
NH2 at para position.
|
58
| |
NHAc at ortho or meta position.
|
20
| |
NHAc at para position.
|
45
| |
Cl at ortho or meta position.
|
0
| |
Cl at para position
|
10
| |
Br at ortho or meta position.
|
2
| |
Br at para position.
|
15
|
Explanation of the modified rules for benzoyl derivatives:
Here,
Parent value
|
246 (Since X = R)
|
Ring residue at ortho position
|
3
|
Ring residue at meta position
|
3
|
Ring residue at para position
|
10
|
NH2 group at ortho position
|
13
|
OR group at meta position
|
7
|
Total
|
= 282 nm
|
[(A more elaborate description of the rules that can be used to determine the λmax of compounds can be found on www.pharmaxchange.
info) – for conjugated diene systems, transoid and cisoid concept is important).
info) – for conjugated diene systems, transoid and cisoid concept is important).

No comments:
Post a Comment