Phase Equilibria
Phase
A phase may be defined as: any homogeneous part of a system having all physical and chemical properties the same throughout. A system may consist of one phase or
more than one phase.
(1) A system containing only liquid water is one-phase or 1-phase system (P = 1)
(2) A system containing liquid water and water vapour (a gas) is a two-phase or
2-phase system (P = 2).
(3) A system containing liquid water, water vapour and solid ice is a three-phase or
3-phase system.
A system consisting of one phase only is called a homogeneous system.
A system consisting of two or more phases is called a heterogeneous system.
Explanation of the Term ‘Phase’
Ordinarily three states of matter-gas, liquid, and solid are known as phases. However in phase rule, a uniform part of a system in equilibrium is termed a ‘phase’.
Thus a liquid or a solid mixture could have two or more phases.
Let us consider a few examples to understand the meaning of the term phase as encountered in phase rule.
(1) Pure substances. A pure substance (solid, liquid, or gas) made of one chemical species only, is considered as one phase. Thus oxygen (O2), benzene (C6H6), and ice (H2O)
are all one-phase systems. It must be remembered that a phase may or may not be continuous. Thus, whether ice is present in one block or many pieces, it is considered one
phase.
(2) Mixtures of gases. All gases mix freely to form homogeneous mixtures. Therefore any mixture of gases, say O2 and N2, is a one-phase system.
(3) Miscible liquids. Two completely miscible liquids yield a uniform solution. Thus a solution of ethanol and water is a one-phase system.
(4) Non-miscible liquids. A mixture of two non-miscible liquids on standing forms two separate layers. Hence a mixture of chloroform (CHCl3) and water constitutes a 2-phase
system.
(5) Aqueous solutions. An aqueous solution of a solid substance such as sodium chloride (or sugar) is uniform throughout. Therefore it is a one-phase system. However, a
saturated solution of sodium chloride in contact with excess solid sodium chloride is a two-phase system.
(6) Mixtures of solids.
(i) By definition, a phase must have throughout the same physical and chemical properties. Ordinary sulphur as it occurs in nature is a mixture of monoclinic and
rhombic sulphur. These allotropes of sulphur consist of the same chemical species but differ in physical properties. Thus mixture of two allotropes is a 2-phase system.
(ii) A mixture of two or more chemical substances contains as many phases. Each of these substances having different physical and chemical properties makes a separate
phase. Thus a mixture of calcium carbonate (CaCO3) and calcium oxide (CaO) constitutes two phases.
Let us consider the equilibrium system: the Decomposition of Calcium carbonate. When calcium carbonate is heated in a closed vessel, we have
CaCO3 ⇌ CaO + CO2
(solid) (solid) (gas)
There are two solid phases and one gas phase. Hence it is a 3-phase system.
Components
A system ‘C’ in the Phase Rule equation stands for the number of components of a system in equilibrium. The term component may be defined as: the least number of
independent chemical constituents in terms of which the composition of every phase can be expressed by means of a chemical equation.
Explanation of the Term ‘Component’
(1) Water and sulphur systems are 1-component systems.
Water system has three phases: ice, water, and water vapour. The composition of all the three phases is expressed in terms of one chemical individual H2O. Thus water
system has one component only.
Sulphur system has four phases: rhombic sulphur, monoclinic sulphur, liquid sulphur and sulphur vapour. The composition of all these phases can be expressed by one
chemical individual sulphur (S). Hence it is a 1-component system.
As is clear from above, when all the phases of a system can be expressed in terms of one chemical individual, it is designated as a one-component or 1-component system.
(2) Mixture of gases.
A mixture of gases, say O2 and N2, constitutes one phase only. Its composition can be expressed by two chemical substances O2 and N2.
Phase Components
Gaseous Mixture = x O2 + y N2
Hence, a mixture of O2 and N2 has two components. In general the number of components of a gaseous mixture is given by the number of individual gases present.
(3) Sodium chloride solution.
A solution of sodium chloride in water is a 1-phase system. Its composition (xNaCl.yH2O) can be expressed in terms of two chemical individuals, sodium chloride and water.
Phase Components
Aq. solution of sodium chloride = NaCl + y H2O
Therefore an aqueous solution of sodium chloride or any other solute is a
two-component or 2-component system.
A saturated solution of sodium chloride, in contact with excess solid sodium chloride has two phases, namely aqueous solution and solid sodium chloride.
The composition of both phases can be expressed in terms of two chemical individuals NaCl and H2O.
Phase Components
Aq. solution of sodium chloride = x NaCl + y H2O
Solid sodium chloride = NaCl + 0 H2O
Hence, a saturated solution of sodium chloride or any other solute in contact with solid solute is 2-component system.
(4) Decomposition of Calcium carbonate.
When calcium carbonate is heated in a closed vessel, the following equilibrium system results.
CaCO3(solid) ⇌ CaO(solid) + CO2(gas)
It has three phases: calcium carbonate, calcium oxide, and carbon dioxide.
The composition of all the phase can be expressed in terms of any two of the three chemical substances in equilibrium.
Let us select calcium oxide (CaO) and carbon dioxide (CO2) as the components.
Then we can write,
Phase Components
CaCO3 = CaO + CO2
CaO = CaCO3 – CO2
CO2 = CaCO3 – CaO
Thus decomposition of calcium carbonate is a 2-components system.
Furthermore, as is clear from the above examples, by the components of a system is meant the number of chemical individuals and not any particular chemical
substances by name.
Degrees of Freedom
The term Degree of Freedom represented by F in the phase Rule equation
(F = C – P + 2) is defined as follows: the least number of variable factors (concentration, pressure and temperature) which must be specified so that the remaining
variables are fixed automatically and the system is completely defined.
A system with F = 0 is known as nonvariant or having no degree of freedom.
A system with F = 1 is known as univariant or having one degree of freedom.
A system with F = 2 is known as bivariant or having two degrees of freedom.
Explanation of the Term Degree of Freedom
A system is defined completely when it retains the same state of equilibrium (or can be reproduced exactly) with the specified variables. Let us consider some examples.
(1) For a pure gas, F = 2. For a given sample of any pure gas PV = RT. If the values of pressure (P) and temperature (T) be specified, volume (V) can have only one definite
value, or that the volume (the third variable) is fixed automatically. Any other sample of the gas under the same pressure and temperature as specified above will be identical
with the first one. Hence a system containing a pure gas has two degrees of freedom (F = 2).
(2) For a mixture of gases, F = 3. A system containing a mixture of two or more gases is completely defined when its composition, temperature and pressure are specified. If
pressure and temperature only are specified, the third variable i.e., composition could be varied. Since it is necessary to specify three variables to define the system completely
, a mixture of gases has three degrees of freedom (F = 3).
(3) For water - water vapour, F = 1. The system water in equilibrium with water vapour has two variables temperature and pressure. At a definite temperature the vapour
pressure of water can have only one fixed value. Thus if one variable (temperature or pressure) is specified, the other is fixed automatically. Hence the system water has one
degree of freedom (F = 1).
(4) For ice-water-vapour system, F = 0. In the system ice ⇌ water ⇌ vapour, the three phases coexist at the freezing point of water. Since the freezing temperature of water
has a fixed value, the vapour pressure of water has also a definite value. The system has two variables (temperature and pressure) and both these are already fixed. Thus the
system is completely defined automatically, there being no need to specify any variable. Hence it has no degree of freedom (F = 0).
Derivation of the Phase Rule
Consider a heterogeneous system in equilibrium of C components in which P phases are present.
We have to determine the degrees of freedom of this system i.e., the number of variables which must be arbitrarily fixed in order to define the system completely. Since the
state of the system will depend upon the temperature and the pressure, these two variables are always there. The concentration variables, however, depend upon the number
of phases.
In order to define the composition of each phase it is necessary to specify the concentration of (C – 1) constituents of each phase, the concentration of the remaining component
being determined by difference. For P phases, therefore, the total number of concentration variables will be P (C – 1) and these along with the two variables mentioned above
viz., temperature and pressure, make the total number of the variables of the system equal to [P (C – 1) + 2].
Again, for a single component in P phases there would be (P-1) dependant variables. And for C components total number of dependant variables would be equal to C(P-1).
Now, degrees of freedom (F) = total number of variables – total number of dependant variables.
= P(C – 1) + 2 - C(P-1)
= C – P + 2
Degrees of freedom for one–component system
For a one-component system we can write the phase rule equation as:
F = C – P + 2 = 1 – P + 2 = 3 – P
Three cases may arise:
Case 1: When only one phase is present,
F = 3 – 1 = 2
Thus the system is bivariant. It can be completely defined by specifying the two variables, temperature and pressure. Or that, both the temperature and pressure can be
varied independently.
Therefore a single phase is represented by an area on P-T graph.
Case 2: When two phases are in equilibrium,
F = 3 – 2 = 1
The system then has one degree of freedom and is termed univariant or monovariant. This means that the pressure cannot be changed independently if we change the
temperature. The pressure is fixed automatically for a given temperature. A two-phase system is depicted by a line on a P-T graph.
Case 3: When three phases are in equilibrium,
F = 3 – P = 3 – 3 = 0
Or, F = 0
The system has zero degree of freedom and is termed nonvariant or invariant. This special condition can be attained at a definite temperature and pressure. The system is,
therefore, defined completely and no further statement of external conditions is necessary. A three-phase system is depicted by a point on the P-T graph.
At this point the three phases (solid, liquid, and vapour) are in equilibrium and, therefore, it is referred to as the Triple point.
Triple Point
The triple point of a substance is the temperature and pressure at which the three phases (gas, liquid and solid) of that substance coexist in thermodynamic equilibrium.
For example, the triple point of mercury occurs at a temperature of -38.830C and
a pressure of 0.2 mPa. Triple point of water is 273.16 K at 611.2Pa
(0.00980C at 4.58 mm of Hg)
A triple point shows the conditions under which all three phases can coexist in equilibrium. Thus, the system at the triple point may be represented as:
Solid ⇌Liquid ⇌ Vapour
Applying the phase rule equation we have-
F = C – P + 2
= 1 – 3 + 2
= 0
This predicts that the system has no degree of freedom at its triple point.
Phase Diagram
A phase diagram is a plot showing the conditions of pressure and temperature under which two or more physical states can exist together in a state of dynamic
equilibrium. Figure 1 is a typical phase diagram for a one-component system. The diagram consists of: 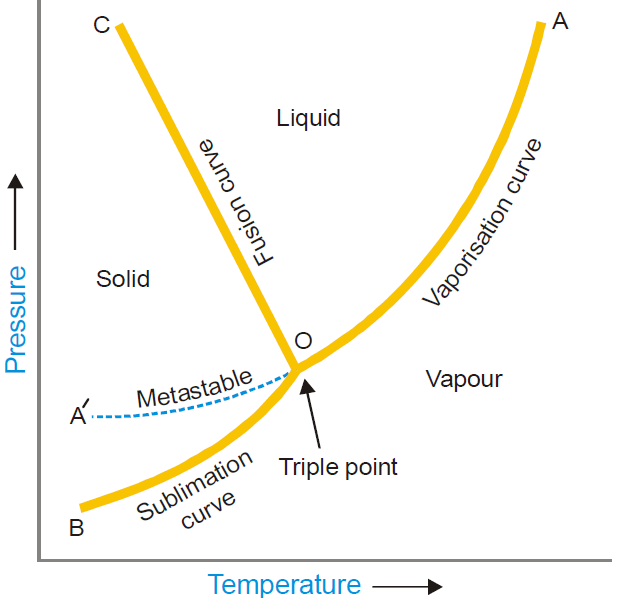
(a) The Regions or Areas;
(b) The Lines or Curves; and
(c) The Triple point.
The significance of the characteristic features (Areas, Curves, Triple point) of a phase diagram are discussed below.
(1) Regions or Areas
The diagram is divided into three regions or areas which are labelled as ‘solid’, ‘liquid’, and ‘vapour’. These areas in Figure 1 are COB, COA and AOB. Each of the three areas
shows the conditions of temperature and pressure under which the respective phase can exist.
Figure 1: A typical phase diagram of a one component system
Applying the phase rule to the system when only one phase is present, we have
F = 1 – 1 + 2 = 2; i.e., each single phase has two degrees of freedom.
Thus each area of phase diagram represents a bivariant system. At conditions wholly within one of the three areas, both the variables (pressure and temperature) can be
varied independently without causing a change in the state of equilibrium. Therefore in order to define the condition of the phase both pressure and temperature must be
stated.
(2) Lines or Curves
There are three lines or curves separating the regions or areas. These curves show the conditions of equilibrium between any two of the three phases i.e., solid/liquid,
liquid/vapour, solid/vapour.
(a) Solid/liquid line (OC) which represents the equilibrium Solid ⇌ Liquid is referred to as the Melting curve or Fusion curve.
(b) Liquid/vapour line (OA) which represents the equilibrium Liquid ⇌ Vapour, is referred to as the Vapour Pressure curve or Vaporisation curve for the liquid.
(c) Solid/vapour line (OB), which represents the equilibrium Solid ⇌ Vapour, is referred to as the Sublimation curve.
Applying phase rule to a one-component two-phase system.
F = C – P + 2 = 1 – 2 + 2 = 1
Thus, phase rule predicts that the two phase equilibria stated above will have one degree of freedom. Along any of three lines on the phase diagram when one variable
(pressure or temperature) is specified, the other is fixed automatically.
(3) Triple Point
The three boundary lines enclosing the three areas on the phase diagram intersect at a common point called the Triple point. A triple point shows the conditions under
which all the three phases (solid, liquid, vapour) can coexist in equilibrium. Thus the system at the triple point may be represented as :
Solid ⇌ Liquid ⇌ Vapour
Applying the phase rule equation, we have
F = C – P + 2 = 1 – 3 + 2 = 0
Which predicts that the system has no degree of freedom.
At the triple point both pressure and temperature on the diagram are fixed and, therefore, the system is nonvariant. This implies that if we try to change temperature or
pressure, the equilibrium will be disturbed. For example, if we lower the pressure on the system, all the liquid will vaporise, leaving only two phases.
In case of water system, the temperature and pressure for the triple point are 0.0098ºC and 4.58 mmHg respectively.
Metastable Equilibrium
The vapour pressure curve AO of the liquid phase terminates at O, when the liquid freezes (or solidifies). However by careful cooling of the liquid under conditions that crystals
do not form, the curve AO can be extended to A'. This means that the liquid can be cooled far below the freezing point or ‘supercooled’ without separation of the crystals. The
supercooled liquid is in an unstable condition.
On the slightest disturbance as introduction of a seed crystal, the entire liquid solidifies rapidly.
Thus the dashed curve OA' represents a metastable equilibrium,
Supercooled Liquid ⇌ Vapour
This system at once reverts to the true stable system
Solid ⇌ Vapour
The Water System
Under normal conditions the system ‘water’ is a three-phase, one-component system. The three phases involved are liquid water, ice, water vapour. All these phases can be
represented by one chemical entity H2O and hence one component of the system. The number of phases which can exist in equilibrium any time depends on the conditions of
temperature and pressure. The phase diagram or P-T graph of the system/ water/ice/vapour is shown in Figure 2. The salient features of the phase diagram are listed below.
(1) The Curves OA, OB, OC
(2) The Triple Point O
(3) The Areas AOC, AOB, BOC
Let us proceed to discuss the significance of each of these features.
(1) The Curves OA, OB, OC
These three curves meet at the point O and divide the diagram into three regions or areas.
Curve OA, the Vapour Pressure curve of Water. It represents the vapour pressure of liquid water at different temperatures. Figure 2: The phase diagram of the system 'Water'
The two phase’s water and water vapour coexist in equilibrium along this curve. The curve OA terminates at A, the critical point (218 atm, temp. 374ºC) when the liquid and
vapour are indistinguishable from each other and there is left one phase only. When the vapour pressure is equal to one-atmosphere, the corresponding temperature, as
indicated on the phase diagram is the boiling point (100ºC) of water.
Curve OB, the Sublimation curve of Ice. It shows the vapour pressure of solid ice at different temperatures. The two phases solid ice and vapour coexist in equilibrium along
this curve. At the lower limit the curve OB terminates at absolute zero (– 273ºC) where no vapour exists.
Curve OC, the Fusion curve of Ice. It depicts the effect of pressure on the melting point of ice.
Here ice and water coexist in equilibrium. The fact that OC slopes to the left indicates that the melting point of ice decreases with increase of pressure. Since ice melts with
decrease in volume by Le Chatelier’s principle the melting point is lowered by an increase of pressure. It may be noted that the 1.0 atmosphere line meets the fusion curve at
0ºC which is the normal melting point of ice. Along the curves OA, OB, OC there are two phases in equilibrium and one component.
Therefore,
F = C – P + 2 = 1 – 2 + 2 = 1
Hence each two-phase system:
water/water vapour represented by OA
ice/water vapour represented by OB
ice/water represented by OC has one degree of freedom i.e., is monovariant.
(2) The Triple point ‘O’
The curves OA, OB and OC meet at the triple point ‘O’ where all the three phases liquid water/ ice/vapour are in equilibrium. This occurs at 0.0078ºC and vapour pressure
4.58 mm Hg. Since there are three phases and one component, we have
F = C– P + 2 = 1 – 3 + 2 = 0
i.e., the system at the triple point is nonvariant. Thus, if either pressure or temperature is changed, the three phases would not exist and one of the phases would disappear.
(3) Area AOC, AOB, BOC
The areas or regions between the curves show the conditions of temperature and pressure under which a single phase–ice, water or vapour is capable of stable existence. Thus,
Area AOC represents conditions for the one-phase system water.
Area AOB represents conditions for the one-phase system water vapour.
Area BOC represents conditions for the one-phase system ice.
In all the three areas there being one-phase and one-component, we have
F = C – P + 2 = 1 – 1 + 2 = 2
Thus each system water, water vapour, or ice has 2 degrees of freedom i.e., the system is bivariant.
(4) Metastable system: Supercooled Water/Vapour System
The vapour pressure curve of water AO can be continued past the triple point as shown by the dashed line OA'. That is, water can be supercooled by carefully eliminating solid
particles. The supercooled water/vapour system is metastable (unstable). It at once reverts to the stable system ice/vapour on the slightest disturbance or introducing a crystal
of ice.
The Sulphur System
It is a one-component, four-phase system. The four phases are:
(a) Two solid polymorphic forms:
(i) Rhombic Sulphur (SR)
(ii) Monoclinic Sulphur (SM)
(b) Sulphur Liquid (SL)
(c) Sulphur Vapour (SV)
All the four phase can be represented by the only chemical individual ‘sulphur’ itself and hence one component of the system.
The two crystalline forms of sulphur SR and SM exhibit enantiotropy with a transition point at 95.6ºC.
Below this temperature SR is stable, while above it SM is the stable variety. At 95.6ºC each form can be gradually transformed to the other and the two are in equilibrium. At
120ºC, SM melts. Thus,
The phase diagram for the sulphur system is shown in Figure 3. The salient features of the phase diagram are described below.
(i) The six curves AB, BC, CD, BE, CE, EG
(ii) The three Triple points B, C, E
(iii) The four areas:
ABG marked ‘solid Rhombic’
BEC marked ‘solid Monoclinic’
GECD marked ‘liquid Sulphur’
ABCD marked ‘Sulphur vapour’
Let us now proceed to discuss the significance of these features:
(1) The curves AB, BC, CD, BE, CE, EG
These six curves divide the diagram into four areas.
Curve AB, the Vapour Pressure curve of SR. It shows the vapour pressure of solid rhombic sulphur (SR) at different temperatures. Along this curve the two phases SR and
sulphur vapour (SV) are in equilibrium. The system SR/SV has one degree of freedom,
F = C – P + 2 = 1 – 2 + 2 = 1 i.e. it is monovariant.
Figure 3: The phase diagram of the system 'Sulphur'
Curve BC, the Vapour Pressure curve of SM: It shows variation of the vapour pressure of monoclinic sulphur (SM) with temperature. SM and SV coexist in equilibrium along
this curve. The system SM/SV is monovariant.
Curve CD, the Vapour Pressure curve of SL: It depicts the variation of the vapour pressure of liquid sulphur (SL) with temperature. SL and SV are in equilibrium along CD. The
two phase system SL/SV is monovariant. One atmosphere line meets this curve at a temperature (444.6ºC) which is the boiling point of sulphur.
Curve BE, the Transition curve: It shows the effect of pressure on the transition temperature for SR and SM. As two solid phases are in equilibrium along the curve, the
system SR/SM is monovariant.
The transformation of SR and SM is accompanied by increase of volume (density of
SR = 2.04; SM = 1.9) and absorption of heat i.e., SR + Q (heat energy) ⇌ SM
Thus, the increase of pressure will shift the equilibrium to the left (Le Chatelier’s Principle) and the transition temperature will, therefore, be raised. This is why the line BE
slopes away from the pressure axis showing thereby that the transition temperature is raised with increase of pressure.
Curve CE, the Fusion curve of SM. It represents the effect of pressure on the melting point of SM. The two phases in equilibrium along this curve are SM and SL. The system
SM/SL is monovariant. As the melting or fusion of SM is accompanied by a slight increase of volume, the melting point will rise by increase of pressure (Le Chatelier’s principle).
Thus the curve CE slopes slightly away from the pressure axis. The curve ends at E because SM ceases to exist beyond this point.
Curve EG, the Fusion curve for SR. Here the two phases in equilibrium are SR and SL. The number of phases being two, the system SR/SL is monovariant.
(2) The Triple points B, C, E
Triple point B. This is the meeting point of the three curves AB, BC and BE. Three phases, solid SR, solid SM and SV are in equilibrium at the point B. There being three phases
and one component, the system SR/SM/SL is nonvariant.
F = C – P + 2 = 1 – 3 + 2 = 0
At B, SR is changed to SM and the process is reversible. Thus the temperature corresponding to B is the transition temperature (95.6ºC).
Triple point C. The curves BC, CD, CE meet at this point. The three phases in equilibrium are SM, SL and SV. There being three phases and one component, the system
SM/SL/SV is nonvariant. The temperature corresponding to C as indicated on the phase diagram is 120ºC. This is the melting point of SM.
Triple point E. The two lines CE and BE, having different inclinations away from the pressure axis, meet at E where a third line EG also joins. The three phases SR, SM and SL
are in equilibrium and the system at the point E is nonvariant. This point gives the conditions of existence of the system SR/SM/SL at 155ºC and 1290 atmospheres pressure.
(3) The Areas
The phase diagram of the sulphur system has four areas or regions. These are labelled as rhombic sulphur, monoclinic sulphur, liquid sulphur and vapour. These represent
single phase systems which have two degrees of freedom,
F = C – P + 2 = 1 – 1 + 2 = 2
That is, each of the systems SR, SM, SL, and SV are bivariant.
Two–Component Systems
When a single phase is present in a two-component system, the degree of freedom is three,
F = 2 – 1 + 2 = 3
This means that three variables must be specified in order to describe the condition of the phase.
Thus in such a system, in addition to pressure and temperature the concentration of one of the components has also to be given. For graphic representation of these variables,
three coordinate axes at right angles to each other would be required. Therefore the phase diagram obtained would be a solid model.
For the sake of having simple plane diagrams we generally consider only two variables, the third one being a constant. For example, for solid-liquid equilibrium, the gas phase
is usually absent and the effect of pressure on the equilibrium is very small. Thus, when a two-component system consists of solid and liquid phases only, the effect of pressure
may be disregarded. Then it is necessary to take into account the remaining variables viz., temperature and concentration.
Such a solid/liquid system with the gas phase absent is called a condensed system.
The experimental measurements of temperature and concentration in condensed systems are usually carried out under atmospheric pressure. Since the degree of freedom in
such a case is reduced by one, we may write the Reduced Phase rule as
F' = C – P + 1
Where, F' gives the remaining degrees of freedom of the system. The reduced phase rule is more convenient to apply to solid/liquid two-component condensed system. Since
the only variables for two-component solid/liquid systems are temperature and composition, the phase diagrams for such systems consist of Temperature-Concentration
graphs (TC graphs).
Simple Eutectic Systems
The general form of the phase diagram of such a 2-component condensed system is shown in Figure 4. Here the two components A and B are completely miscible in the liquid
state, and these solutions on cooling yield only pure A or pure B as solid phases.
Figure 4: Simple Eutectic Diagram
The diagram consists of:
Curve AC; the Freezing point curve of A: The point A represents the freezing point of A. The curve AC shows that the freezing point of A falls by the addition of B to A. Thus
along this curve, the solid A is in equilibrium with the liquid solution of B in A.
Curve BC; the Freezing point curve of B: The point B shows the freezing point of B. The curve BC exhibits the fall of freezing point by the addition of A to B. Along this curve
, the solid B is in equilibrium with the liquid solution of A in B.
Applying the reduced phase rule equation to the equilibria represented by the curve AC and CB i.e., solid A/solution and solid B/solution respectively, we have
F = C – P + 1 = 2 – 2 + 1 = 1
The degree of freedom is one i.e., both equilibria are monovariant.
The Eutectic point C: The two curves AC and BC meet at the point C. Here both the solids A and B must be in equilibrium with the solution phase (solution of A and B). The
number of phases is 3. By applying the reduced phase rule equation, we have
F' = C – P + 1 = 2 – 3 + 1 = 0
Thus, the system represented by the point C is nonvariant. In other words, both temperature and composition of the system solid A-solid B-solution is fixed. The mixture of
components A and B as at point C melts at the lowest temperature TE indicated on the graph. The point C is therefore, called the Eutectic point
(Greek eutectos = easy melting). The corresponding composition (CE) and temperature (TE) are known as the eutectic composition and the eutectic temperature respectively
of the system.
The eutectic mixture, although it has a definite melting point, is not to be regarded as a compound. The reasons are: (i) the components are not in stoichiometric
proportions; and (ii) on examination under a microscope these reveal the existence of separate crystals of the components.
The Area above the curves AC and BC: Here the two components A and B are present as liquid solutions of varying compositions. As a homogeneous solution of A and B
constitutes one phase only, this system is bivariant.
F = C – P + 1 = 2 – 1 + 1 = 2
Therefore, to define the system at any point in this area, both temperature and composition have to be specified.
Effect of Cooling
When the A/B solution at any point in the area above ACB is cooled, the cooling dashed line meets the curve AC, say at Y. Here solid A separates and the equilibrium shifts
down along the curve AC. The change of composition and temperature continues till the eutectic point C is reached when solid B also separates.
Thus in the area below AC and above TE line, there exist two phases viz., solid A and solution A/B, and the system is bivariant. Similarly, cooling of solution B/A on the other
side of eutectic, on reaching the curve BC would yield solid B/solution system. Thus, the area below BC up to TE line would represent solid B and solution.
If the solution just above the eutectic point is cooled, a solid mixture (eutectic mixture) of eutectic composition CE, will be obtained straightaway.
Since below TE line no liquid can exist, the entire area below this line would represent the system solid A/solid B.
The Silver–Lead System
This system has two components and four phases.
The phases are: (i) solid silver; (ii) solid lead; (iii) solution of molten silver and lead; and (iv) vapour.
The boiling points of silver and lead being considerably high, the vapour phase is practically absent. Thus Ag/Pb is a condensed system with three phases. In such a case,
pressure can have no effect on the system. Therefore we need consider only the two remaining variables, namely the temperature (T) and concentration (C). The complete TC
diagram of the system Ag/Pb is shown in Figure 5.
Figure 5: The phase diagram of Ag/Pb system
The salient features of the diagram are:
(a) Two curves, AC and BC
(b) Eutectic point, C
(c) Three areas:
(i) above ACB;
(ii) below AC;
(iii) below BC
Curve AC; the Freezing point curve of Ag: A represents the freezing point or melting point of solid silver (961ºC) and the curve AC shows that the addition of lead lowers the
melting point along it. The phases in equilibrium along AC are solid silver and solution of silver and lead. Applying the reduced phase rule equation
F' = C – P + 1 = 2 – 2 + 1 = 1
Thus the system Ag/solution is monovariant.
Curve B; the Freezing point curve of Pb: B represents the melting point of solid lead (327ºC) and the curve BC shows that the melting point is lowered by addition of silver.
The phases in equilibrium along BC are solid lead and solution. The system is monovariant.
The Eutectic point C: The curves AC and BC intersect at C, which is called the eutectic point.
Here three phases solid Ag, solid Pb, and solution are in equilibrium. Applying the reduced phase rule equation
F' = C – P + 1 = 2 – 3 + 1 = 0
Thus the system Ag/Pb/solution at C is nonvariant. Both the variables, temperature (303ºC) and composition (97.5% Pb, 2.5% Ag) are fixed. If you raise the temperature above
the eutectic temperature, the solid phases Ag and Pb disappear and if you cool below it, you will land in the solid Ag/Pb area where solution phase is non-existent.
The Area above AOC: This region represents the single phase system, the solution of molten Ag and Pb. Applying the reduced phase rule equation, we have
F' = C – P + 1 = 2 – 1 + 1 = 2
Thus the system solution Ag/Pb is bivariant.
The area below AC represents the phases Ag + solution, while that below BC the phases Pb + solution. The area below the temperature 303ºC, represents solid Ag + solid Pb.
All these areas have two phases and one degree of freedom,
F = C – P + 1 = 2 – 2 + 1 = 1
Freeze-drying or Lyophilization
Freeze-drying (also known as lyophilization or cryodesication) is a dehydration process typically used to preserve a perishable material or to make the material more
convenient for transport. Freeze-drying works by freezing the material and then reducing the surrounding pressure to allow the frozen water in the material to sublime directly
from the solid phase to gas phase.
The Freeze-drying process
There are four stages in the complete drying process: i) pre-treatment, ii) freezing,
iii) primary drying and iv) secondary drying.
Pre-treatment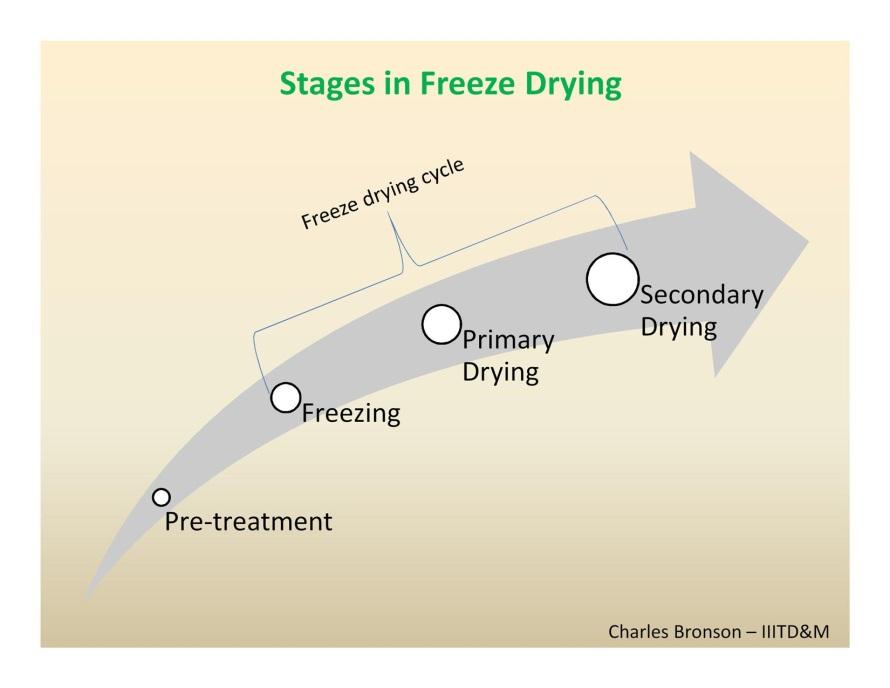
Pretreatment includes any method of treating the product prior to freezing. This may include concentrating the product, formulation revision (i.e. addition of components to
increase stability and to improve processing), decreasing a high vapor pressure solvent or increasing the surface area.
Freezing
In a lab, this is often done by placing the material in a freeze-drying flask and rotating the flask in bath, called a shell freezer, which is cooled by mechanical refrigeration, dry
ice and methanol or liquid nitrogen. On a large scale, freezing is usually done using a freeze-drying machine. In this step, it is important to cool the material below its triple
point, the lowest temperature at which the solid and liquid phases of the material can coexist. This ensures that sublimation rather than melting will occur in the following
steps. Larger crystals are easier to freeze-dry. To produce larger crystals, the product should be frozen slowly or can be cycled up and down in temperature. This cycling
process is called annealing.
Primary Drying
During primary drying phase, the pressure is lowered and enough heat is supplied to the material for the water to sublime. The amount of heat necessary can be calculated
using the sublimating molecule’s latent heat of sublimation. In this initial drying phase, about 95% of water in the material is sublimated. This phase may be slow (can be
several days in the industry), because, if too much heat is added, the material’s structure can be altered.
Secondary Drying
The secondary drying phase aims to remove unfrozen water molecules, since the ice was removed in the primary drying phase. In this phase, the temperature is raised higher
than that in the primary drying phase, and can even be above 00C, to break any physico-chemical interactions that have formed between the water molecules and the frozen
material. Usually the pressure is also lowered in this stage to encourage desorption. 
At the end of the operation, the final residual water content in the product is extremely low, around 1% to 4%.
Importance of freeze-drying
Some essential aspects of freeze-drying are
Freeze-drying is a crucial enabling process for many important parenteral drugs.
Close to 60% of biopharmaceuticals including enzymes, proteins and monoclonal antibodies must be lyophilized as these therapeutic agents are insufficiently stable for
ready-to-use solution dosage form.
A small but growing number of small molecule drugs are also prepared in this manner. It is safe but that without lyophilization, the majority of these products would not
be available.
In solution, many drug substances are susceptible to even modest changes in temperature and chemical environment. These complex molecules undergo hydrolytic,
oxidative and aggregation reactions comprising both potency and safety. Consequently, parenterals must often be distributed cold-chained-refrigerated or maintained
frozen from manufacturing line to patient. Even then, freezing or thawing may cause some proteins to aggregate. Lyophilization overcomes poor stability by rendering
labile drugs and proteins in a solid form more tolerant of long-term product storage.
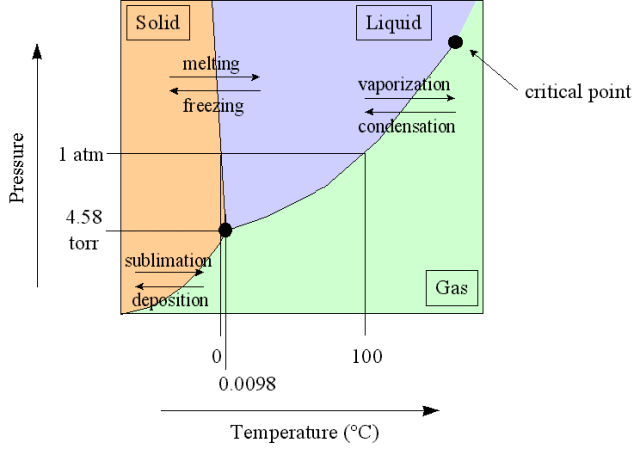
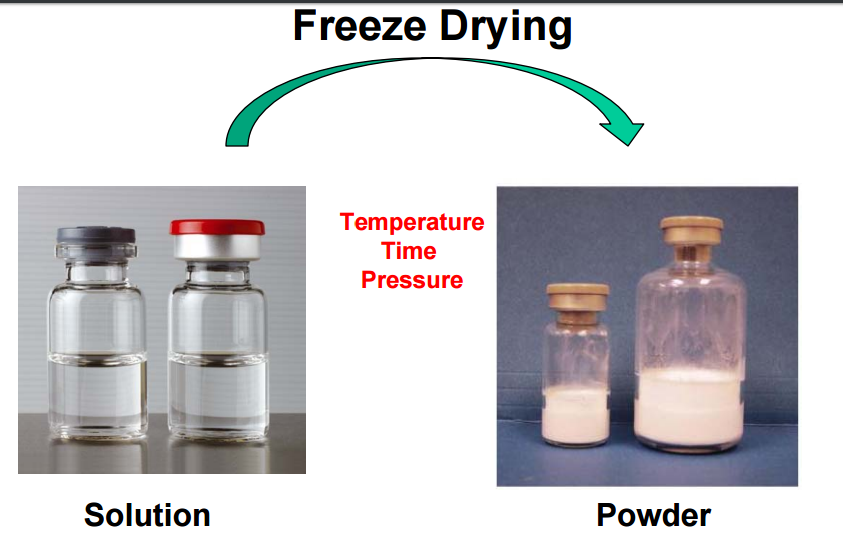
Figure: The Result of freeze drying.
Slide Share Link:
Direct download link:
Get the Power Point Slides
Slide Share Link:
Watch Video Tutorials
Software Help