
Ionic Equilibria
pH
The pH concept is very convenient for expressing hydrogen ion concentration. It was introduced by Sorensen in 1909. It is defined as the negative of the base-10 logarithm (log) of the H+
concentration. Mathematically it may be expressed as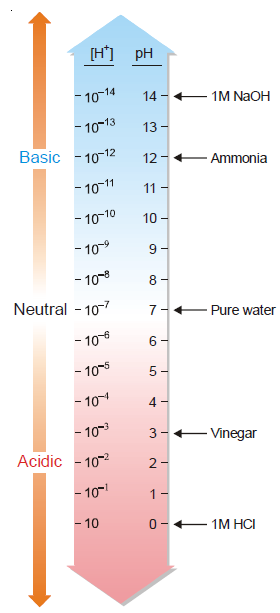
concentration. Mathematically it may be expressed as
pH = – log [H+] or, [H+] = 10– pH
Where [H+] is the concentration of hydrogen ions in moles per litre.
Concentration of OH– ions in aqueous solution of a base is expressed as
p[OH–] = – log [OH–]
(b) Equilibrium constant for water is written as
pKw = –log [Kw]
For any quantity X, we can write
pX = –log X
The “p” in these expression means “ –log of the quantity”
pH Scale
In order to express the hydrogen ion concentration or acidity of a solution, a pH scale was evolved. The scale on which pH values are computed is called the pH scale. pH values are calculated
in this scale taking water as their reference standard.
The highest value is [H+] = 100 mole/L--------------------------------------(1).
in this scale taking water as their reference standard.
The highest value is [H+] = 100 mole/L--------------------------------------(1).
From the dissociation of water we got the lowest value is [H+] = 10– 14mole/L---------------------------------------(2)
Taking negative logarithm on the both side of the equation 1 and 2 we get,
-log[H+] = -log100=0
and -log[H+] = -log10-14=14
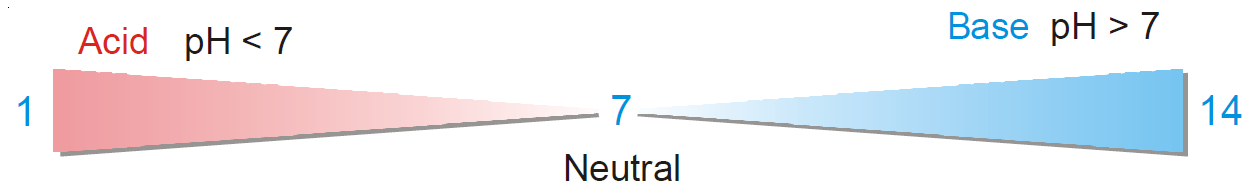
On this scale the values range from 0 to 14. Since pH is defined as – log [H+] and the hydrogen ion concentration of water is 10– 7, the pH of water is 7. All solutions having pH less than 7 are
acidic and those with pH greater than 7 are basic, and equal 7 is neutral solution.
acidic and those with pH greater than 7 are basic, and equal 7 is neutral solution.
As shown by the pH scale, pH decreases with the increase of [H+]. The lower the pH, higher is the [H+] or acidity.
Dissociation of Water
Water dissociates to H+ and OH– ions to a very small degree so that we have the equilibrium.
H2O⇌ H+ + OH– ...............................................................(1)
We can write the equilibrium expression as
Since water is so little dissociated, the concentration of undissociated molecules, [H2O], is presumed to be constant. Therefore from expression (2) we can write
[H+] [OH–] = K [H2O] = Kw = a constant………………………………..(3)
where Kw is called the water dissociation constant or the water ionisation constant.
When the concentrations of H+ and OH– ions in water are expressed in mole per litre, the value of Kw found experimentally is 1.0 × 10⁻¹⁴
The concentration of H+ and OH– ions in pure water is equal. Using the expression (3), we have
[H+] [OH–]= Kw = 1.0×10⁻¹⁴
[H+] [OH–]= Kw =
or [H+] = [OH–] = 1.0 × 10– 7 mol/l
Thus the H+ ion and OH– ion concentrations in pure water are both 10–7 mol l–1 at 25°C and it is said to be neutral.
Now taking negative logarithm on the both sides of the equation 3 we get
-log ([H+] [OH–]) = -log Kw
-log [H+] -log[OH–] = -log Kw
pH+pOH=pKw
pH+pOH=pKw
Thus, pKw = pH + pOH
Since Kw = 1.0 × 10⁻¹⁴
So, pKw = –log (1.0 × 10⁻¹⁴) = 14.00
Hence, for any aqueous solution at 25°C, pH and pOH add up to 14.00.
That is,pH + pOH = 14.00
That is,pH + pOH = 14.00
PROBLEM 1. The hydrogen ion concentration of a fruit juice is 3.3 × 10⁻² M. What is the pH of the juice ? Is it acidic or basic?
PROBLEM 2. If a solution has a pH of 7.41, determine its H+ concentration.
Acid-Base Titration
Titration(aka titrimetry) is a common laboratory technique used for quantitative chemical analysis.
Titration is a process of neutralization whereby a titrant (a solution of known concentration) is added into an analyte (a solution of unknown concentration) until the
unknown solution is completely neutralized. Because volume measurement plays a key role in titration, it is also known as volumetric analysis.
unknown solution is completely neutralized. Because volume measurement plays a key role in titration, it is also known as volumetric analysis.
An indicator can signal the completion of the reaction (by colour change) and the concentration of the unknown solution can be determined.
Any chemicals that react in solution can be titrated with each other. Since acids and bases are usually found in solution, they are commonly involved in titrations.
Titrations of a strong acid or a strong base involve the neutralization reaction between hydrogen ions and hydroxyl ions. These ions combine to form the neutral water
molecule:H2O⇌ H+ + OH–
Titrations of a strong acid or a strong base involve the neutralization reaction between hydrogen ions and hydroxyl ions. These ions combine to form the neutral water
molecule:H2O⇌ H+ + OH–
Titrant/Titrator: The standard solution of known concentration that is being added to the solution of unknown concentration is called titrant. This is more often the acid than
the base.
the base.
Analyte/Titrand: The solution of unknown concentration. Usually the base.
Equivalence point (neutralization or endpoint): The point when the titration is theoretically stopped, where the number of moles of titrant is equal to the number of moles of
analyte, or some multiple thereof (as in di- or tri- protic acids).
analyte, or some multiple thereof (as in di- or tri- protic acids).
Indicator: An acid-base indicator is an organic dye that signals the end-point by a visual change in colour. It changes colour over a certain pH range, and indicates the end
of the titration. The end-point of a titration is shown by colour change of an indicator previously added to the acid solution in the receiver flask. e.g. Phenolphthalein and
methyl orange .
of the titration. The end-point of a titration is shown by colour change of an indicator previously added to the acid solution in the receiver flask. e.g. Phenolphthalein and
methyl orange .
Phenolphthalein is pink in base solution and colourless in acid solution. Thus phenolphthalein signals the end-point by a colour change from colourless to pink. Similarly methyl
orange indicates the end-point by a colour change from red (in acid) to yellow (in base).
orange indicates the end-point by a colour change from red (in acid) to yellow (in base).
pH range of indicators
Most indicators do not change colour at a particular pH. They do so over a range of pH from two
to three units. This is called the pH range which is different for various indicators.
Table: pH ranges of some acid-base indicators.

Titration curves
During an acid-base titration the pH of the solution in the receiver flask changes with the addition of the titrant from the burette. A plot of pH against the volume of the titrant
being added is known as pH curve or titration curve.
being added is known as pH curve or titration curve.
For illustration, the pH curve produced by titration of HCl solution with NaOH solution is shown in figure following figure. As NaOH is added, the pH of the solution increases
slowly at first, then rapidly in the vicinity of the equivalence point and again slowly. The equivalence point lies in the middle of the vertical portion of the curve (pH=7). It must be
clearly understood that equivalence point is the theoretical end-point of a titration. The end-point of a titration determined by a colour change of the indicator in titration
solution is the experimental estimate of the equivalence point.
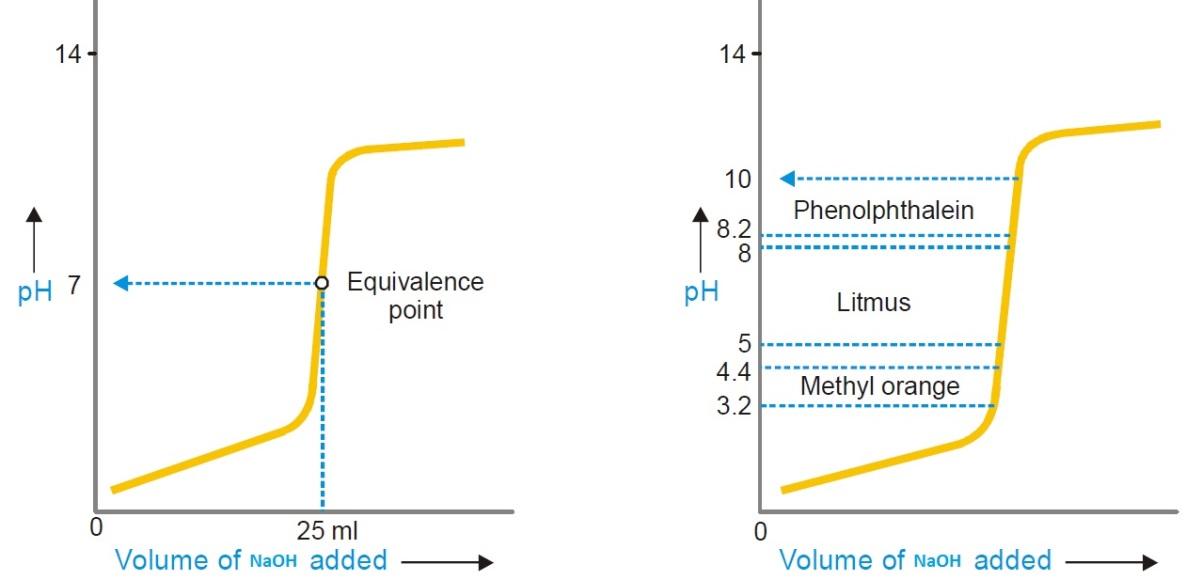
Figure 1: titration curve for titration of a strong base with strong acid. Figure 2: Indicator ranges for phenolphthalein, litmus and methyl orange.
The titration curve in Fig. 1. Shows that it remains vertical around the equivalence point.
Thus, a suitable indicator for a given titration may be defined as one which has as narrow a pH range as possible that lies entirely on the upright part of the titration curve.
For example, as shown in figure 2, phenolphthalein, litmus and methyl orange may be used as indicators for acid-base titrations.
Titration error
100% accurate measurement is not possible. Practical value and theoretical value is never same. So, the difference between the theoretical value and practical value of a titration
is known as titration error.
is known as titration error.
Titration error = theoretical value – practical value
For example, if the theoretical value of a titration is 5 but the examination value is 4.91 then titration error = 5 - 4.91= 0.09.
CHOICE OF A SUITABLE INDICATOR
The choice of a suitable indicator for a particular acid-base titration depends on the nature of the acid and the base involved in the titration.
Titrating a Strong acid with a Strong base: Both methyl orange and phenolphthalein are suitable indicators for strong acid/strong base titrations.
Titrating a Weak acid with a Strong base: Phenolphthalein is a suitable indicator, while methyl orange is not.
Titrating a Strong acid with a Weak base: Evidently, methyl orange and methyl red are suitable indicators for strong acid/weak base titrations.
Titrating a acid with a Weak base: Under these conditions, all indicators change colour only gradually and no indicator is suitable.
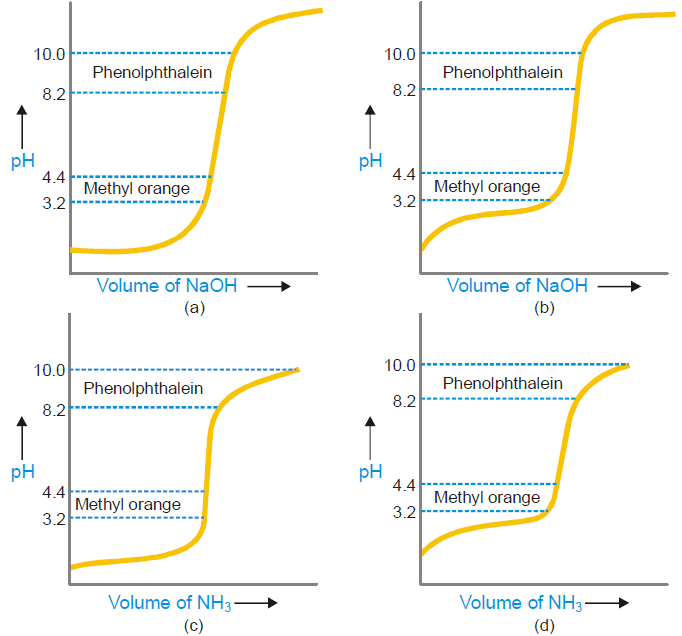
To find a suitable indicator from a study of the pH curves for : (a) a strong acid and strong base; (b) weak acid and strong base;(c) strong acid and weak base; (d) a weak acid and weak base.
Slide Share Link:
Direct download link:
Get the Power Point Slides
Slide Share Link:
Watch Video Tutorials
Software Help
No comments:
Post a Comment